 | | H. Eugene Lockhart
Mr. Lockhart has served on our board of directors since December 2006. He is the Chairman of the Audit Committee, and also serves on the Compensation Committee.
Professional Experience In November 2013,2012, Mr. Lockhart became Senior Advisor North America, at General Atlantic LLC, a leading global growth investment firm. In October 2013,2014, he founded and became chairmanChairman and Managing Partner of MissionOG LLC, a growth stage investment firm. From 2002 until 2012, Mr. Lockhart was a venture partner at Oak Investment Partners, a venture capital firm. His prior positions include president of Global Retail Bank at Bank of America, as well as president and chief executive officer of MasterCard International. Through these investment firms, Mr. Lockhart has been actively involved in overseeing the management of high growth private companies, including NetSpend, Argus Information, Metro Bank PLC, CLIP, DemystData, Factor Trust, Avant, BillDesk, and others. Board Service Mr. Lockhart was appointed to the board of Metro Bank PLC, a public retail bank operating in the U.K., in March 2011, where he presently serves as the Chair of the risk and audit committee. He had served on the board of Aaron’s, Inc., alease-to-own retailer of furnishings, consumer electronics and home appliances, infrom August 2014.2014 until May 2016. He previously served as a director and audit committee chairman of RadioShack Corporation, a retail seller of consumer electronic goods and services, until March 2015. Mr. Lockhart served on the board of directors of Bonds.com, a trading platform for fixed income securities, from February 2011 until September 2013. He had served on the board of Asset Acceptance Capital Corp., a purchaser of accounts receivable portfolios, from consumer credit originators, until its June 2013 merger with Encore Capital Group, Inc., and also served on the board of IMS Health Incorporated, a global provider of information solutions to the pharmaceutical and healthcare industries, until February 2010. Mr. Lockhart has served on numerous philanthropic boards, including serving in the past as the Chair of the Thomas Jefferson Foundation (Monticello) and the Chairman of the Darden School Foundation at the University of Virginia. He is currently serving as the Chairman of Academic Affairs for the State Council of Higher Education of Virginia (SCHEV). Education Mr. Lockhart received a B.S. in Mechanical Engineering from the University of Virginia and an MBA from The Darden Graduate School of Business at the University of Virginia. In addition, Mr. Lockhart is a CPA, licensed in the Commonwealth of Virginia. Individual Contributions Mr. Lockhart brings to Huron’s board his broadconsiderable experience overseeing and growing companies in which he represents venture capital investors, his experience as chief executive officer of leading corporations, and his service on the boards of companies and foundations in a variety ofsuch fields that includeas healthcare, education, pharmaceuticals, and financial services, healthcare and pharmaceuticals.services. In addition, as a former executive and chairman of some of the world’s most recognizedvisible companies in the world, Mr. Lockhart contributes to Huron his many contacts, including those with investors.a broad array of contacts. | | |  |  | | George E. Massaro Director since May 2004 Noaminating and Corporate Governance Committee (Member) |
Professional Experience Mr. Massaro resumed the position ofhas served as Vice Chairman of Huron’s board insince May 2010, a role heand had previously served in the role from March 2005 until July 2009, when2009. In the interim, he was appointed had served asNon-executive Chairman of Huron in order to assist the new management team upon the departureduring a period of our former chairman. Mr. Massaro served as Non-executive Chairman of Huron’s board from July 2009 until May 2010. He has served as a director since May 2004.transition. Mr. Massaro joined the Company in August 2002 as a managing director, served as our Chief Operating Officer from June 2003 until March 2005, and endedceased his employment with Huron in February 2009. He serves on the Nominating and Corporate Governance Committee. Professional Experience
Prior to joining Huron, Mr. Massaro served as the managing partner of Arthur Andersen LLP’s1,200-person New England practice from 1998 to 2002 and managing partner of the Boston office from 1995 to 1998. Mr. Massaro has served clients in the financial services and high-technology industries. Board Service Mr. Massaro serveshas served as a director of Charles River Laboratories, a public provider of research products and preclinical services for the biomedical community, since 2003, and currently serves as chairman of the audit committee. Mr. Massaro had served as a member of the board of trustees of Mount Auburn Hospital in Cambridge until December 2017. He had served as a member of the finance committee of the Archdiocese of Boston until December 2017. Mr. Massaro had also served on the board of directors of Eastern Bank Corporation, an independent mutual bank holding company in New England. He is also a member of the board of trustees of Mount Auburn Hospital in Cambridge. In addition, Mr. Massaro is a member of the finance committee of the Archdiocese of Boston. England, from February 2003 until December 2017. Education Mr. Massaro received a B.A. in Accounting and Finance from Bentley College and an MBA from Babson College. Individual Contributions AsMr. Massaro contributes to the formerHuron board his unique understanding of our business and history, gained not only through his prior service as our Chief Operating Officer of Huron from 2003 to 2005, but also through his leadership of a Huron practice. Mr. Massaro possesses a distinctive understanding of Huron’s business and history. HisMassaro’s many years of experience in public accounting, and management of a professional services practice, as well as hisand service on the boards of healthcare and pharma-centered institutions, enablehave enabled him to provide a broad range ofinvaluable business insights as well asalong with contacts in the business community.
EXECUTIVE OFFICERS The Company’s executive officers are as follows: | | | | | | | | Name | | Age | | | Position | James H. Roth | | | 60 | | | Chief Executive Officer, President and Director | C. Mark Hussey | | | 57 | | | Executive Vice President and Chief Operating Officer | John D. Kelly | | | 42 | | | Executive Vice President, Chief Financial Officer and Treasurer | Diane E. Ratekin | | | 61 | | | Executive Vice President, General Counsel and Corporate Secretary |
James H. Roth’s biographical information is provided above under the caption “Directors Not Standing for Election.” | | |  | | John S. Moody
Mr. MoodyC. Mark Husseywas appointed Chief Operating Officer of Huron in February 2014. He has served on our board of directorsas Executive Vice President since November 2005.July 2011. He had served as Chief Financial Officer from July 2011 until January 2017. From that dateJuly 2011 until February 2016, he served as Chairman of the Compensation Committee, on which he continuesHuron’s Treasurer. Prior to serve. He also serves on the Audit Committee.
Professional Experience
Since January 2014,joining Huron, from 2002 to 2011, Mr. Moody has been chief executive officer of Parkside Capital, formerly known as ProTerra Realty, a fund manager investing in real estate in Houston, Texas. He had previouslyHussey served as president of Parkside Capital since January 2007. From 2004chief financial officer at Crosscom National, LLC, a privately held professional IT services organization deploying and servicingin-store technology solutions for large, national retailers. In that role, he was responsible for all finance and administrative functions for the company. Prior to that, from 2000 until October 2005, Mr. Moody2002, he served as executive vice president and chief executivefinancial officer, of HRO Asset Management, LLC, a real estate advisory business. From 2001 to 2004,North America, at Information Resources, Inc. During his career, Mr. Moody servedHussey has held senior finance, accounting and investor relations positions at entities such as president of Marsh & McLennan Real Estate Advisors,EZLinks Golf, Inc., a business that directed the execution of real estate projects and transactions for Marsh & McLennan. From 1995 to 2000, Mr. Moody was president and chief executive officer of Cornerstone Properties,Dominick’s Finer Foods, Inc., and the Quaker Oats Company. Mr. Hussey received a REIT that acquired, developedB.S. in Accountancy from the University of Illinois, Urbana-Champaign and operated large-scale Class A office buildingsan MBA in major markets throughoutFinance from the United StatesUniversity of Chicago Graduate School of Business. He is a Chartered Financial Analyst, Certified Management Accountant, and that merged into Equity Office Properties Trust.Certified Public Accountant (Illinois).
Board Service
In November 2015, Mr. Moody John D. Kellywas appointed chairmanExecutive Vice President and Chief Financial Officer of the board of Four Corners Property Trust, Inc., a public real estate investment trust, where he also serves as chairman of the compensation committee. Mr. Moody joined the board of Hines Global REIT, a privately owned real estate investment, development and management company, in June 2009. He joined the board of directors of Potlatch Corp., a real estate investment trust, in September 2006, andHuron in January 2009, he assumed the role of vice chairman of Potlatch Corp. From 2001 to 2005, Mr. Moody served on the boards of directors of three publicly held REITs: Keystone Property Trust, CRIIMI MAE, Inc. and Equity Office Properties Trust.
Education
Mr. Moody received a B.A. in History from Stanford University and a J.D. with honors from The University of Texas School of Law.
Individual Contributions
Mr. Moody has spent the majority of his career working with real estate related businesses.2017. He has served on multiple boardsas Huron’s Treasurer since February 2016. He had served as Chief Accounting Officer of directors, includingHuron from February 2015 until January 2017, and had served as Corporate Vice President from November 2012 until his appointment as Executive Vice President. Previously, Mr. Kelly had served as Controller of Huron from November 2012 until February 2015, and prior to that served as Assistant Controller from October 2009. Mr. Kelly served as Huron’s Assistant Treasurer from February 2015 until February 2016. Prior to joining Huron’s Finance and Accounting department, Mr. Kelly was a Director in the Company’s Disputes and Investigations practice for three years, serving as chairmanclients in the manufacturing and vice chairman, of companies organized as real estate investment trusts engagedservices industries. Before he joined the Company in commercial real estate, as wellDecember 2006, Mr. Kelly had held several positions within Deloitte & Touche’s Assurance and Advisory Services group, most recently as a company offering diversified forest products. AsSenior Manager. He received both a B.S. and M.S. in Accounting from the former chief executive officerUniversity of Notre Dame. Mr. Kelly is a public company which owned Class A office buildings throughout the United States, as well as a professionally trained real estate and corporate attorney with broad experience in the capital markets, Mr. Moody has provided introductions to his many business contacts.
|
Certified Public Accountant (Illinois). | | |  | | Debra Zumwalt
Ms. Zumwalt Diane E. Ratekinwas elected to Huron’s board of directors in October 2014. She is the Chair of the Compensation Committee, and also serves on the Nominating and Corporate Governance Committee.
Professional Experience
Since 2001, Ms. Zumwalt has been theappointed Vice President and General Counsel of Stanford UniversityHuron in February 2011, and iswas named Executive Vice President in chargeApril 2011. She was appointed Corporate Secretary in December 2011. She had previously served as Huron’s Assistant Corporate Secretary since May 2009. Ms. Ratekin has been employed in Huron’s legal department since January 2005, and previously served as Deputy General Counsel. Prior to joining Huron, Ms. Ratekin was a partner in the Corporate Department of McGuireWoods LLP. Previously, she spent 17 years in the legal department of Deutsche Investment Management Americas Inc., formerly known as Zurich Scudder Investments, Inc. and Kemper Financial Services, Inc., where she was a Director and Team Leader of the legal services provided to the UniversityCorporate and its two affiliated hospitals with combined annual revenues of over $9 billion.Investments Team. Before that, Ms. ZumwaltRatekin was a litigator at Jenner & Block. She is a member of the University CabinetAmerican Bar Association and provides governance, legal and strategic advicethe Chicago Bar Association. In July 2017, Ms. Ratekin was appointed to the boards of the University, Stanford Health Care, Lucile Packard Children’s Hospital at Stanford and Stanford Management Company, which manages over $24 billion in assets. Ms. Zumwalt is also a member of theMetropolitan Chicago Board of Overseers for SLAC National Accelerator Laboratory at Stanford, and a director of SUMIT Holding International, LLC and SUMIT Insurance Company Ltd., a holding company and captive insurance company providing insurance coverage for the Stanford hospitals and physicians. From 1993 to 2001, Ms. Zumwalt was a partner at Pillsbury Winthrop LLP, where she specialized in complex civil litigation and higher education law, and for whom she served as managing partner of the Silicon Valley office and a member of the firm’s governing board. Previously, from 1987 to 1993, Ms. Zumwalt was Senior University Counsel at Stanford, responsible for advising and representing the University in connection with congressional hearings, criminal and civil investigations, negotiations and litigation matters. Prior to joining Stanford in 1987, Ms. Zumwalt worked as litigation counsel for Chevron Chemical Company and as a litigation associate for Pillsbury Winthrop LLP in San Francisco.
Board Service
Ms. Zumwalt is currently a director of Exponent, Inc., an engineering and scientific consulting company. She is also on the boardDirectors of the American University of Afghanistan and the Academy of Art University and has served on other nonprofit boards in education and legal services.
Education
Ms. ZumwaltHeart Association. She received a B.S.B.A. in Political Science from Arizona State UniversityEnglish and a J.D. from Stanford Law School.the University of Iowa.
DIRECTOR INDEPENDENCE Individual Contributions
As a practicing attorneyOur Corporate Governance Guidelines require that the board of directors make an annual determination regarding the independence of each of our directors. The board of directors has determined that each of Messrs. Edwards, Lockhart, Massaro, McCartney and in-house counsel to a university with two affiliated hospitals,Moody and Ms. Zumwalt is able“independent” as defined in the applicable listing standards of The NASDAQ Stock Market, Inc. (“NASDAQ”). In making its determination, the board of directors considered the standards of independence set forth in the NASDAQ Corporate Governance
Listing Standards and all relevant facts and circumstances to shareascertain whether there was any relationship between a director and the Company that, in the opinion of the board of directors, would interfere with the Huron board a depthexercise of experience negotiatingindependent judgment in carrying out the challenges faced by both higher education and healthcare organizations. Through her former serviceresponsibilities of the director or any material relationship with the Company (either directly, or as a court appointed arbitratorpartner, stockholder or officer of an organization that has a relationship with the Company). In determining that Ms. Zumwalt is independent, the board of directors conducted a thorough review of payments made by Stanford University, which employs Ms. Zumwalt, to the Company for consulting services provided by the Company. After taking into consideration that Stanford University engagements comprised 0.12% of Huron’s revenues for the year 2017, 0.60% for the year 2016, and bar association president,0.25% for the year 2015, the board of directors determined that this relationship would not interfere with Ms. Zumwalt’s exercise of independent judgment in carrying out her responsibilities as wella director. BOARD COMPOSITION, LEADERSHIP STRUCTUREAND RISK OVERSIGHT BOARD COMPOSITION The Nominating and Corporate Governance Committee, in conjunction with the Chair and the full board, is actively evaluating the future composition of the board in light of the age, tenure and experience of its current members. This multi-year refresh process is intended to ensure that the board has the best mix of knowledge, skills and business acumen, derived from high quality professional experience, to evaluate and support the Company’s strategy going forward. The Nominating and Corporate Governance Committee believes that its current directors, several of whom have extensive experience leading and managing professional service businesses, provide significant insight into the Company and its operations and provide valuable contributions to the board. The Committee also recognizes the potential benefits of the fresh perspectives that highly qualified new directors might bring to the board. The Nominating and Corporate Governance Committee will consider a variety of factors as her current rolesit works to enhance the composition of the board, increase diversity, reduce average tenure and ensure structured and orderly board succession through a process of both board member additions and retirements. As a result, during the next several years, the board may occasionally expand or contract as the refresh process is executed. It is the expressed desire of the board that it continue to remain relatively small in number and composed principally ofnon-executive directors. The Nominating and Corporate Governance Committee will consider as director on corporatecandidates qualified individuals recommended by stockholders through the process described below and, academic boards, Ms. Zumwalt contributes a unique perspective onalthough it has not done so in the lawpast, may consider candidates identified by professional search firms. BOARD LEADERSHIP Huron formally separated the roles of chairman of the board and governance. |
Executive Officers
The Company’s executive officers are as follows:
| | | | | | | Name
| | Age | | | Position
| James H. Roth
| | | 58 | | | chief executive officer in 2010. OurNon-executive Chairman is John McCartney and our Chief Executive Officer Presidentis James H. Roth. AsNon-executive Chairman, Mr. McCartney, in consultation with Mr. Roth, develops the agendas for board meetings, determines the appropriate scheduling for board meetings, assesses the quality, quantity and Director | C. Mark Hussey
| | | 55 | | | Executive Vice President, Chief Operating Officer and Chief Financial Officer | Diane E. Ratekin
| | | 59 | | | Executive Vice President, General Counseltimeliness of information provided from management to the board, assists the Nominating and Corporate Secretary |
James H. Roth’s biographical information is provided above under the caption “Nominees to Board of Directors.”
C. Mark Hussey was appointed Chief Operating Officer in February 2014. He has also served as Executive Vice President and Chief Financial Officer since July 2011. From that time until February 2016, he served as Huron’s Treasurer. Prior to joining Huron, from 2002 to 2011, Mr. Hussey served as chief financial officer at Crosscom National, LLC, a privately held professional IT services organization deploying and servicing in-store technology solutions for large, national retailers. In that role, he was responsible for all finance and administrative functions for the company. Prior to that, from 2000 until 2002, he served as executive vice president and chief financial officer, North America, at Information Resources, Inc. During his career, Mr. Hussey has held senior finance, accounting and investor relations positions at entities such as EZLinks Golf, Inc., Dominick’s Finer Foods, Inc., and the Quaker Oats Company. Mr. Hussey received a B.S. in Accountancy from the University of Illinois, Urbana-Champaign and an MBA in Finance from the University of Chicago Graduate School of Business. He is a Chartered Financial Analyst, Certified Management Accountant, and Certified Public Accountant (Illinois).
Diane E. Ratekin was appointed Vice President and General Counsel of Huron in February 2011, and was named Executive Vice President in April 2011. She was appointed Corporate Secretary in December 2011. She had previously served as Huron’s Assistant Corporate Secretary since May 2009. Ms. Ratekin has been employed in Huron’s legal department since January 2005, and previously served as Deputy General Counsel. Prior to joining Huron, Ms. Ratekin was a partner in the Corporate Department of McGuireWoods LLP. Previously, she spent 17 years in the legal department of Deutsche Investment Management Americas Inc., formerly known as Zurich Scudder Investments, Inc. and Kemper Financial Services, Inc., where she was a Director and Team Leader of the Corporate and Investments Team. Before that, Ms. Ratekin was a litigator at Jenner & Block. She is a member of the American Bar Association, the Chicago Bar Association and the Association of Corporate Counsel. She received a B.A. in English and a J.D. from the University of Iowa.
Director Independence
Our Corporate Governance Guidelines require that the board of directors make an annual determination regarding the independence of each of our directors. The board of directors has determined that each of Messrs. Edwards, Lockhart, Massaro, McCartney and Moody and Ms. Zumwalt is “independent” as defined in the applicable listing standards of The NASDAQ Stock Market, Inc. (“NASDAQ”). In making its determination, the board of directors considered the standards of independence set forth in the NASDAQ Corporate Governance Listing Standards and all relevant facts and circumstances to ascertain whether there was any relationship between a director and the Company that, in the opinion of the board of directors, would interfere with the exercise of independent judgment in carrying out the responsibilities of the director or any material relationship with the Company (either directly, or as a partner, stockholder or officer of an organization that has a relationship with the Company). In determining that Ms. Zumwalt is independent, the board of directors conducted a thorough review of payments made by Stanford University, which employs Ms. Zumwalt, to the Company for consulting services provided by the Company. After taking into consideration that Stanford University engagements comprised under 0.25% of Huron’s revenues for the year 2015, under 0.20% for the years 2014 and 2013, and under 0.50% for the years 2012 and 2011, the board of directors determined that this relationship would not interfere with Ms. Zumwalt’s exercise of independent judgment in carrying out her responsibilities as a director.
Board Leadership Structure and Risk Oversight
Board Leadership. Huron formally separated the roles of chairman of the board and chief executive officer in 2010. Our Non-executive Chairman is John McCartney and our Chief Executive Officer is James H. Roth. As Non-executive Chairman, Mr. McCartney, in consultation with Mr. Roth, develops the agendas for board meetings, determines the appropriate scheduling for board meetings, assesses the quality, quantity and timeliness of information provided from management to the board, assists the Nominating and Corporate Governance Committee in monitoring and implementing our Corporate Governance Guidelines and otherwise takes steps to ensure that the board is acting in the long-term best interests of the Company. Mr. McCartney also chairs executive sessions of the board. In addition, George E. Massaro serves as Vice Chairman.
The board has determined that our current board leadership structure is appropriate for the Company, as it believes the separation of powers is beneficial for our organization.
Risk Oversight. One of the board’s responsibilities is to review the adequacy of the Company’s systems for compliance with all applicable laws and regulations for safeguarding the Company’s assets and for managing the major risks it faces. The board executes its responsibility for risk management directly and through its committees.
In 2015, Huron formed the Enterprise Risk Management Committee, comprised of certain members of senior management in the Company. The purpose of the Enterprise Risk Management Committee is to provide a collaborative, ongoing assessment of the material enterprise risks facing the Company. The Enterprise Risk Management Committee oversees a process to anticipate, identify, prioritize, and manage material risks to the Company. Enterprise risk includes any strategic, operational, financial and compliance risks that may materially affect the Company’s ability to achieve its business objectives.
The board committees oversee risk matters associated with their respective areas of responsibility. For example, in addition to receiving reports from PricewaterhouseCoopers LLP (“PwC”), Huron’s independent registered public accounting firm, regarding significant accounting and financial reporting developments, our internal control over financial reporting and other matters, the Audit Committee receives reports from:Governance Committee in monitoring and implementing our Corporate Governance Guidelines and otherwise takes steps to ensure that the board is acting in the long-term best interests of the Company. Mr. McCartney also chairs executive sessions of the board. In addition, George E. Massaro serves as Vice Chairman.
The board has determined that our current board leadership structure is appropriate for the Company, as it believes the separation of powers is beneficial for our organization. RISK OVERSIGHT One of the board’s responsibilities is to review the adequacy of the Company’s systems for compliance with all applicable laws and regulations, for safeguarding the Company’s assets and for managing the major risks it faces. The board executes its responsibility for risk management directly and through its committees in a variety of ways, including the following: The General Counsel on legal developments;
Huron’s internal auditors on internal controls and financial compliance control matters;
The Chief Compliance Officer on whistleblower hotline and compliance related issues; and
The Enterprise Risk Management Committee on the group’s activities and the processes and controls in place to manage Huron’s material business risks.
The full board regularly considers potential business risks facing the Company, including those surrounding such issues as:
International compliance;
In 2015, we reviewed our material compensation policies and practices and reported to the Compensation Committee that these policies and practices are considered not to entail risks reasonably likely to have a material adverse effect on the Company. The Chief Compliance Officer, the CFO, the General Counsel, the Corporate Vice President, Human Resources and the Director
| | | Board of Compensation reviewed the plan elements, potential risks and various controls in place with respect to Huron’s executive, managing director, employee and business developer compensation plans. After reviewing the findings made by this group, the Compensation Committee agreed with the assessment that the compensation policies and practices are considered not to entail risks reasonably likely to have a material adverse effect on the Company. Board Meetings and Committees
The board of directors conducts its business through meetings of the full board, actions taken by written consent in lieu of meetings, and by the actions of its committees. During 2015, the board of directors held 11 meetings.
During 2015, each board member attended at least 75% of the aggregate number of board meetings and meetings of all the committees on which the director served. Although the Company does not have a formal policy regarding director attendance at our annual meetings, we encourage directors to attend. All directors attended the 2015 Annual Meeting of Stockholders.
The board of directors operates in part through its three committees: Audit, Compensation, and Nominating and Corporate Governance. All committee members are “independent” as defined in the applicable listing standards of NASDAQ. In addition, all Compensation Committee members are “non-employee directors” within the meaning of Rule 16b-3 under the Securities Exchange Act of 1934 (the “1934 Act”) and “outside directors” within the meaning of Section 162(m) of the Internal Revenue Code of 1986, as amended (the “Code”), and all Audit Committee members meet the criteria for independence set forth in SEC Rule 10A-3(b)(1). A detailed discussion of each committee’s mission, composition and responsibilities is contained within the committee charters available in the Investor Relations section of the Company’s web site at www.huronconsultinggroup.com.
Audit Committee. The Audit Committee responsibilities include overseeing our accounting and financial reporting processes and overseeing the audits of our financial statements and internal control over financial reporting. The Audit Committee is also responsible for the appointment, compensation, retention, oversight and evaluation of the work of any registered public accounting firm engaged for the purpose of preparing or issuing an audit report or performing other services for us. Approval of audit and permitted non-audit services and applicable fees is made by the Audit Committee. The Audit Committee met eight times in 2015. The members of the Audit Committee are Messrs. Lockhart (Chairman), McCartney and Moody. The board of directors has determined that each Audit Committee member has sufficient knowledge in financial and auditing matters to serve on the Audit Committee. The board of directors has also determined that each of Messrs. Lockhart, McCartney and Moody is an “audit committee financial expert,” as defined by the applicable securities regulations, and that each member of the Audit Committee satisfies the applicable NASDAQ listing standards for audit committee membership.
The Report of the Audit Committee for the fiscal year ended December 31, 2015 appears below under the caption “PROPOSAL 3—RATIFICATION OF APPOINTMENT OF INDEPENDENT REGISTERED PUBLIC ACCOUNTING FIRM—Report of the Audit Committee.”
Compensation Committee. Pursuant to its charter, the Compensation Committee responsibilities include overseeing our compensation and benefit plans, including all compensation arrangements for executive officers and directors, each of which the Compensation Committee reviews annually and makes changes as it deems appropriate. The Compensation Committee met seven times in 2015. The members of the Compensation Committee are Ms. Zumwalt (Chair), Mr. Lockhart and Mr. Moody.
Management assists the Compensation Committee in the performance of its duties as described in more detail below under “EXECUTIVE COMPENSATION—Compensation Discussion and Analysis—Role of Management.” In addition, during 2015, the CEO participated in all of the Compensation Committee’s meetings and in all of the executive sessions, except for those in which the Compensation Committee considered the CEO’s performance, compensation and incentives. The committee extended the engagement of Semler Brossy Consulting Group, LLC as its outside compensation advisor to assist the committee in the execution of its charter. The support provided by the advisor is described in more detail below under “EXECUTIVE COMPENSATION—Compensation Discussion and Analysis—Role of Compensation Advisor.” The Report of the Compensation Committee on Executive Compensation appears below under the caption “EXECUTIVE COMPENSATION—Compensation Committee Report.”
Nominating and Corporate Governance Committee. The Nominating and Corporate Governance Committee responsibilities include identifying and recommending to the board of directors appropriate director nominee candidates and providing oversight with respect to corporate governance matters. The Nominating and Corporate Governance Committee met five times in 2015. The members of the Nominating and Corporate Governance Committee are Mr. Edwards (Chairman), Mr. Massaro and Ms. Zumwalt.
Directors may be nominated by the board of directors or by stockholders in accordance with the bylaws of the Company. The Nominating and Corporate Governance Committee will review all candidates for nomination to the board of directors, including those proposed by stockholders as provided below. The Nominating and Corporate Governance Committee reviews the person’s judgment, experience, independence, understanding of the Company’s business or other related industries, and such other factors as the Nominating and Corporate Governance Committee determines are relevant in light of the needs of the board of directors and the Company. The board of directors believes that its nominees should reflect over time a diversity of experience, gender, race, ethnicity and age, although it follows no strict criteria when making decisions. The Nominating and Corporate Governance Committee selects qualified candidates and reviews its recommendations with the board of directors, which will decide whether to invite the candidate to be a nominee for election to the board of directors. If the Nominating and Corporate Governance Committee receives a nominee recommendation in accordance with the rules of the SEC from a stockholder or group of stockholders that has beneficially owned more than 5% of the Company’s voting common stock for at least one year as of the date of the recommendation, the name of the candidate, the name(s) of the stockholder(s) who recommended the candidate, and whether the Nominating and Corporate Governance Committee chose to nominate the candidate will be disclosed in the proxy statement, if the consent of both the stockholder and the candidate has been received.
For a stockholder to submit a candidate for consideration by the Nominating and Corporate Governance Committee, a stockholder must notify the Company’s Corporate Secretary. In addition, the Company’s bylaws permit stockholders to nominate directors at a stockholders’ meeting. To make a director nomination at the annual meeting, a stockholder must notify the Company’s Corporate Secretary within the time periods specified under “SUBMISSION OF STOCKHOLDER PROPOSALS” below. Notices should be sent to: Corporate Secretary, Huron Consulting Group Inc., 550 West Van Buren Street, 17th Floor, Chicago, Illinois 60607, or corporatesecretary@huronconsultinggroup.com. In either case, the notice must meet all of the requirements contained in the bylaws.
Director Resignation Policy
The Company’s Corporate Governance Guidelines provide that in an uncontested election, any nominee for director who receives a greater number of votes “withheld” from his or her election than “for” his or her election shall promptly tender his or her resignation to the board of directors following certification of the election results, subject to acceptance by the board of directors. For purposes of this policy, (i) an “uncontested” election is one in which the number of persons properly nominated for election as directors as of the date that is ten (10) days before the record date for determining stockholders entitled to notice of or to vote at such meeting is not greater than the number of directors to be elected, and (ii) broker non-votes will not be counted as either votes “withheld” from or “for” such person’s election.
The Nominating and Corporate Governance Committee shall make a recommendation to the board of directors as to whether to accept or reject the tendered resignation, or whether other action should be taken. The board of directors shall determine whether to accept or reject the tendered resignation, or whether other action should be taken, in its sole discretion, and publicly disclose its decision regarding the tendered resignation within ninety (90) days from the date of the certification of the election results. The Nominating and Corporate Governance Committee in making its recommendation and the board of directors in making its decision may each consider any factors or other information that they consider appropriate and relevant.
If any director’s resignation is not accepted by the board of directors, such director shall continue to serve until such director’s successor is duly elected and qualified, or until such director’s earlier death, resignation, retirement, disqualification or removal. If a director’s resignation is accepted by the board of directors pursuant to this policy, then the board of directors, in its sole discretion, may fill any resulting vacancy pursuant to the provisions of Section 2 of Article III of the bylaws of the Company or may decrease the size of the board of directors pursuant to Section 1 of Article III of the bylaws of the Company.
Stockholder Communications Policy
| | • Regularly considers potential business risks facing the Company, including those surrounding security and privacy, revenue recognition, quality assurance, strategic planning, employee retention, international compliance, business continuity, merger integration and market shifts • Maintains oversight of key governance programs relating to insider trading, business conduct and ethics, export controls and other critical issues | Audit Committee | | • Meets with and reviews reports from independent registered public accounting firm and internal auditors • Receives regular reports from the General Counsel on legal developments • Examines issues presented by the Chief Compliance Officer on whistleblower hotline and corporate compliance-related matters • Considers reports of the Enterprise Risk Management Committee on strategic, operational, financial and compliance risks that may materially affect the Company’s ability to achieve its business objectives • Evaluates controls in place to address Huron’s global FCPA risks | Compensation Committee | | • Annually reviews a risk assessment of all Huron compensation plans • Reviews the design and goals of compensation programs in the context of potential risks to the Company • Reviews and evaluates compensation arrangements to assess the potential for undue risk taking | | Nominating and Corporate Governance Committee | | • Leads an annual self-assessment to ensure the board and its committees are properly fulfilling their roles • Ensures board candidates possess the appropriate experience and expertise required to effectively serve on Huron’s board • Annually reviews Huron’s corporate governance guidelines to confirm they reflect best practices |
BOARD MEETINGSAND COMMITTEES The board of directors conducts its business through meetings of the full board, actions taken by written consent in lieu of meetings, and by the actions of its committees. During 2017, the board of directors held 12 meetings. During 2017, each board member attended at least 75% of the aggregate number of board meetings and meetings of all the committees on which the director served. Although the Company does not have a formal policy regarding director attendance at our annual meetings, we encourage directors to attend. Six directors attended the 2017 Annual Meeting of Stockholders. The board of directors operates in part through its three committees: Audit, Compensation, and Nominating and Corporate Governance. All committee members are “independent” as defined in the applicable listing standards of NASDAQ. In addition, all Compensation Committee members are“non-employee directors” within the meaning of Rule16b-3 under the Securities Exchange Act of 1934 (the “1934 Act”) and “outside directors” within the meaning of Section 162(m) of the Internal Revenue Code of 1986, as amended (the “Code”), and all Audit Committee members meet the criteria for independence set forth in SEC Rule10A-3(b)(1). A detailed discussion of each committee’s mission, composition and responsibilities is contained within the committee charters available in the Investor Relations section of the Company’s web site atwww.huronconsultinggroup.com. Audit Committee The Audit Committee responsibilities include overseeing our accounting and financial reporting processes, the audits of our financial statements, and the Company’s internal controls over financial reporting. The Audit Committee is also responsible for the appointment, compensation, retention, oversight and evaluation of the work of any registered public accounting firm engaged for the purpose of preparing or issuing an audit report or performing other services for us. As such, the Audit Committee approves audit and permittednon-audit services and applicable fees. The Audit Committee met ten times in 2017. The members of the Audit Committee are Messrs. Lockhart (Chair), McCartney and Moody. The board of directors has determined that each Audit Committee member has sufficient knowledge in financial and auditing matters to serve on the Audit Committee. The board of directors has also determined that each of Messrs. Lockhart, McCartney and Moody is an “audit committee financial expert,” as defined by the applicable securities regulations, and that each member of the Audit Committee satisfies the applicable NASDAQ listing standards for audit committee membership. The Report of the Audit Committee for the fiscal year ended December 31, 2017 appears below under the caption “PROPOSAL 3—RATIFICATION OF APPOINTMENT OF INDEPENDENT REGISTERED PUBLIC ACCOUNTING FIRM—Report of the Audit Committee.” Compensation Committee Pursuant to its charter, the Compensation Committee responsibilities include overseeing our compensation and benefit plans, including all compensation arrangements for executive officers and directors, each of which the Compensation Committee reviews annually and makes changes as it deems appropriate. The Compensation Committee met seven times in 2017. The members of the Compensation Committee are Ms. Zumwalt (Chair), Mr. Lockhart and Mr. Moody. Management assists the Compensation Committee in the performance of its duties as described in more detail below under “EXECUTIVE COMPENSATION—Compensation Discussion and Analysis—Role of Management.” In addition, during 2017, the CEO participated in all of the Compensation Committee’s meetings and in all of the executive sessions, except for those in which the Compensation Committee considered the CEO’s performance, compensation and incentives. The Committee engaged the firm of Pay Governance LLC as its outside compensation advisor to assist the Committee in the execution of its charter. The support provided by the advisor is described in more detail below under “EXECUTIVE COMPENSATION—Compensation Discussion and Analysis—Role of Compensation Advisor.” The Report of the Compensation Committee on Executive Compensation appears below under the caption “EXECUTIVE COMPENSATION—Compensation Committee Report.” Nominating and Corporate Governance Committee The Nominating and Corporate Governance Committee responsibilities include identifying and recommending to the board of directors appropriate director nominee candidates and providing oversight with respect to corporate governance matters. The Nominating and Corporate Governance Committee met four times in 2017. The members of the Nominating and Corporate Governance Committee are Mr. Edwards (Chair), Mr. Massaro and Ms. Zumwalt. Directors may be nominated by the board of directors or by stockholders in accordance with the bylaws of the Company. The Nominating and Corporate Governance Committee will review all candidates for nomination to the board of directors, including those proposed by stockholders as provided below. The Nominating and Corporate Governance Committee reviews the person’s judgment, experience, independence, understanding of the Company’s business or other related industries, and such other factors as the Nominating and Corporate Governance Committee determines are relevant in light of the needs of the board of directors and the Company. The board of directors believes that its nominees should reflect over time a diversity of experience, gender, race, ethnicity and age, although it follows no strict criteria when making decisions. The Nominating and Corporate Governance Committee selects qualified candidates and reviews its recommendations with the board of directors, which will decide whether to invite the candidate to be a nominee for election to the board of directors. If the Nominating and Corporate Governance Committee receives a nominee recommendation in accordance with the rules of the SEC from a stockholder or group of stockholders that has beneficially owned more than 5% of the Company’s voting common stock for at least one year as of the date of the recommendation, the name of the candidate, the name(s) of the stockholder(s) who recommended the candidate, and whether the Nominating and Corporate Governance Committee chose to nominate the candidate will be disclosed in the proxy statement, if the consent of both the stockholder and the candidate has been received. For a stockholder to submit a candidate for consideration by the Nominating and Corporate Governance Committee, a stockholder must notify the Company’s Corporate Secretary. In addition, the Company’s bylaws permit stockholders to nominate directors at a stockholders’ meeting. To make a director nomination at the annual meeting, a stockholder must notify the Company’s Corporate Secretary within the time periods specified under “SUBMISSION OF STOCKHOLDER PROPOSALS” below. Notices should be sent to: Corporate Secretary, Huron Consulting Group Inc., 550 West Van Buren Street, 17th Floor, Chicago, Illinois 60607, orcorporatesecretary@huronconsultinggroup.com. In either case, the notice must meet all of the requirements contained in the bylaws. DIRECTOR RESIGNATION POLICY The Company’s Corporate Governance Guidelines provide that in an uncontested election, any nominee for director who receives a greater number of votes “withheld” from his or her election than “for” his or her election shall promptly tender his or her resignation to the board of directors following certification of the election results, subject to acceptance by the board of directors. For purposes of this policy, (i) an “uncontested” election is one in which the number of persons properly nominated for election as directors as of the date that is ten (10) days before the record date for determining stockholders entitled to notice of or to vote at such meeting is not greater than the number of directors to be elected, and (ii) brokernon-votes will not be counted as either votes “withheld” from or “for” such person’s election. The Nominating and Corporate Governance Committee shall make a recommendation to the board of directors as to whether to accept or reject the tendered resignation, or whether other action should be taken. The board of directors shall determine whether to accept or reject the tendered resignation, or whether other action should be taken, in its sole discretion, and publicly disclose its decision regarding the tendered resignation within ninety (90) days from the date of the certification of the election results. The Nominating and Corporate Governance Committee in making its recommendation and the board of directors in making its decision may each consider any factors or other information that they consider appropriate and relevant. If any director’s resignation is not accepted by the board of directors, such director shall continue to serve until such director’s successor is duly elected and qualified, or until such director’s earlier death, resignation, retirement, disqualification or removal. If a director’s resignation is accepted by the board of directors pursuant to this policy, then the board of directors, in its sole discretion, may fill any resulting vacancy pursuant to the provisions of Section 2 of Article III of the bylaws of the Company or may decrease the size of the board of directors pursuant to Section 1 of Article III of the bylaws of the Company. STOCKHOLDER COMMUNICATIONS POLICY The Company’s board of directors has established a process for stockholders to send communications to the board of directors. Stockholders may communicate with any member of the board of directors, including the chairperson of any committee, an entire committee or the independent directors or all directors as a group, by sending written communications to: Corporate Secretary Huron Consulting Group Inc. 550 West Van Buren Street 17th Floor Chicago, Illinois 60607 E-mail messages should be sent tocorporatesecretary@huronconsultinggroup.com. A stockholder must include his or her name and address in any such written ore-mail communication. The communication must indicate that the sender is a Company stockholder. Each communication intended for the board of directors and received by the Corporate Secretary that is related to the operation of the Company and is not otherwise commercial in nature will be forwarded to the specified party following its clearance through normal security procedures. If the communication is mailed as personal, it will not be opened, but rather will be forwarded unopened to the intended recipient. Diversity of Board Skills and ExperienceDIVERSITYOF BOARD SKILLSAND EXPERIENCE
Huron does not have a formal policy on board member diversity. The Nominating and Corporate Governance Committee, in discussing board composition, has focused on diversity of experience in relation to the development of the business. The Nominating and Corporate Governance Committee seeks candidates from regions where Huron offices are located, with prior management experience and experience on public company boards and in relevant industries. Compensation of DirectorsCOMPENSATIONOF DIRECTORS
The Huronnon-employee director compensation program is designed to enhance our ability to attract and retain highly qualified directors and to align their interests with the long-term interests of our stockholders. The program consists of both a cash component, designed to compensate independent directors for their service on the board and its committees, and an equity component, designed to align the interests of independent directors and stockholders. Mr. Roth receives no compensation for his service on the board. The 2015Effective as of July 1, 2016, the director compensation program hadis comprised of the following elements:
•
• Non-executive Chairman - $235,000
• Vice Chairman - $85,000
• Other independent directors - $60,000
•
Board and committee meeting fee of $1,000 per meeting (The Chairman does not receive board or committee meeting fees.) •
Annual committee chairperson retainer of: • Compensation - $7,500$15,000
• Nominating and Corporate Governance - $7,500$10,000
Annual restricted stock grant of $170,000 (granted on the date of the Company’s annual meeting and priced based upon the closing stock price on the date immediately preceding the annual meeting)of grant) which vests ratably over 12 quarters. If a new independent director joins the board after the Company’s annual meeting, the award is prorated as follows: • If the new director joins within six months of the Company’s annual meeting, the new director will receive half of the annual grant.
• If the new director joins over six months after the Company’s annual meeting, no grant will be made.
Stock ownership requirement – independent directors are expected to own Huron stock equal to the lesser of three times the annual cash retainer (currently $180,000) or 9,000 shares. A new independentnon-employee director will receive an initial restricted stock grant equal to $200,000, which will vest ratably over 12 quarters. All directors are reimbursed forout-of-pocket expenses for attending board and committee meetings. Directors are eligible to participate in our deferred compensation plan, which is described under the caption “EXECUTIVE COMPENSATION—20152017 Nonqualified Deferred Compensation.” One director has participated since 2013, and a second director elected to participate beginning in 2015. Director Compensation TableDIRECTOR COMPENSATION TABLE
The following table summarizes the fees paid and the aggregate grant date fair value of shares granted to each of thenon-employee directors in 2015.2017. Directors who are also officers or employees of the Company receive no compensation for duties performed as a director. | | | | | | | | | Name | | Fees Earned or
Paid in Cash ($) | | Stock
Awards($)(1) | | Change in Pension
Value and
Nonqualified
Deferred
Compensation
Earnings ($)(2) | | Total ($) | DuBose Ausley (3) | | 48,000 | | — | | — | | 48,000 | James D. Edwards (3) | | 82,500 | | 169,978 | | — | | 252,478 | H. Eugene Lockhart (3) | | 93,000 | | 169,978 | | — | | 262,978 | George E. Massaro (3) | | 100,000 | | 169,978 | | — | | 269,978 | John McCartney (3) | | 235,000 | | 169,978 | | 0 | | 404,978 | John S. Moody (3) | | 88,500 | | 169,978 | | — | | 258,478 | Debra Zumwalt (4) | | 76,000 | | 169,978 | | 0 | | 245,978 |
| | | | | | | | | | | | | | | | | | Name (5) | | Fees Earned or
Paid in Cash ($) | | | Stock
Awards ($)(1) | | | Change in Pension
Value and Nonqualified
Compensation
Earnings ($)(2) | | | Total ($) | | James D. Edwards (3) | | | 85,000 | | | | 169,990 | | | | — | | | | 254,990 | | H. Eugene Lockhart (3) | | | 101,000 | | | | 169,990 | | | | — | | | | 270,990 | | George E. Massaro (3) | | | 101,000 | | | | 169,990 | | | | — | | | | 270,990 | | John McCartney (3)(4) | | | 235,000 | | | | 169,990 | | | | 112,816 | | | | 517,806 | | John S. Moody (3) | | | 89,000 | | | | 169,990 | | | | — | | | | 258,990 | | Debra Zumwalt (3) | | | 96,000 | | | | 169,990 | | | | 19,872 | | | | 285,862 | |
| (1) | This column represents the aggregate grant date fair value of shares granted to our directors in 2015.2017. Grant date fair value is based on the closing price of Huron stock on the last trading day prior to the grant date.of grant. Each of these grants vests ratably over the 12 calendar quarters following the grant. |
| (2) | The amount in this column represents investment gains in the deferred compensation plan. Huron does not offer a pension plan. The amount shown above represents that portion of the account earnings for 20152017 that exceeded the SEC benchmark “market” rate equal to 120% of the long-term applicable federal rate (based on the average rate for 20152017 of 3.05%2.72%). For 2015,2017, the actual earnings for Mr. McCartney and Ms. Zumwalt were -$1,798$134,348 and -$207,$28,141, respectively. These amounts were less than the 3.05% market rate. |
| (3) | Upon his retirement from the board in May 2015, the vesting of Mr. Ausley’s restricted common stock was accelerated. At December 31, 2015,2017, each of Messrs. Edwards, Lockhart, Massaro, McCartney, Moody and MoodyMs. Zumwalt held 4,2705,158 shares of restricted common stock.
|
| (4) | At December 31, 2015, Ms. Zumwalt held 4,986 sharesMr. McCartney has access to office space at the Company’s principal business offices in Chicago. The Company does not incur any incremental costs in connection with the provision of restricted common stock.this office space.
|
| (5) | Hugh E. Sawyer was appointed to the board in February 2018. He had previously served as a managing director at Huron from January 2010 until May 2017, where he led the Operational Improvement Service Line for Huron’s Business Advisory practice. All compensation paid to Mr. Sawyer in 2017, which consisted of base salary paid through his departure and payment of his 2016 bonus, was in connection with his managing director role. |
Section 16(a) Beneficial Ownership Reporting ComplianceSECTION 16(A) BENEFICIAL OWNERSHIP REPORTING COMPLIANCE
Pursuant to Section 16(a) of the 1934 Act, the Company’s directors, executive officers and persons who beneficially own 10% or more of our common stock (the “Section 16 Reporting Persons”) are required to report their initial ownership of common stock and subsequent changes in that ownership to the SEC. Section 16 Reporting Persons are required to furnish the Company with copies of all Section 16(a) forms that they file. Based upon our review of forms filed by the Section 16 Reporting Persons pursuant to the 1934 Act, we have not identified any late filings in 2015.2017. Stock Ownership of Certain Beneficial Owners and ManagementSTOCK OWNERSHIPOF CERTAIN BENEFICIAL OWNERSAND MANAGEMENT
The following table sets forth, as of the Record Date, certain information regarding the beneficial ownership of our common stock by: each person known by us to beneficially own 5% or more of our common stock; each of our named executivesexecutive officers; each member of our board of directors; and all directors and executive officers as a group. Beneficial ownership is determined according to the rules of the Securities and Exchange Commission (the “SEC”) and generally means that a person has beneficial ownership of a security if he or she possesses sole or shared voting or investment power of that security and includes options that are currently exercisable or exercisable within 60 days. Each director, officer or 5% or more stockholder, as the case may be, has furnished us with information with respect to beneficial ownership. Except as otherwise indicated, beneficial owners of common stock listed below, based on the information each of them has given to us, have sole investment and voting power with respect to their shares, except where community property laws may apply. | | | | | | | | | | | | Beneficial Ownership | | Name of beneficial owner (1) | | Shares | | | % | | Beneficial owners of 5% or more: | | | | | | | | | Wellington Management Group LLP (2) | | | 2,316,070 | | | | 10.69 | | The Vanguard Group, Inc. (3) | | | 1,548,521 | | | | 6.75 | | FMR LLC (4) | | | 1,499,735 | | | | 6.54 | | TimesSquare Capital Management, LLC (5) | | | 1,425,477 | | | �� | 6.20 | | BlackRock, Inc. (6) | | | 1,242,933 | | | | 5.40 | | Directors and Executive Officers: | | | | | | | | | James D. Edwards (7) | | | 18,983 | | | | * | | C. Mark Hussey (8) | | | 41,866 | | | | * | | H. Eugene Lockhart (9) | | | 23,193 | | | | * | | George E. Massaro (10) | | | 17,172 | | | | * | | John McCartney (11) | | | 51,325 | | | | * | | John S. Moody (12) | | | 18,782 | | | | * | | Diane E. Ratekin (13) | | | 37,083 | | | | * | | James H. Roth (14) | | | 349,672 | | | | 1.61 | | Debra Zumwalt (15) | | | 6,898 | | | | * | | All directors and executive officers as a group (9 persons) (16) | | | 564,974 | | | | 2.60 | |
| | | | | | | | | | | | Beneficial Ownership | | | Name of beneficial owner (1) | | Shares | | | % | | Beneficial owners of 5% or more: | | | | | | | | | Wellington Management Group LLP (2) | | | 3,102,878 | | | | 14.02 | | Van Berkom & Associates Inc. (3) | | | 1,927,915 | | | | 8.71 | | The Vanguard Group, Inc. (4) | | | 1,774,571 | | | | 8.01 | | BlackRock, Inc. (5) | | | 1,444,220 | | | | 6.50 | | Dimensional Fund Advisors LP (6) | | | 1,393,051 | | | | 6.30 | | Boston Partners (7) | | | 1,286,433 | | | | 5.81 | | FMR LLC (8) | | | 1,173,291 | | | | 5.30 | | Directors and Executive Officers: | | | | | | | | | James D. Edwards (9) | | | 21,524 | | | | * | | C. Mark Hussey (10) | | | 98,945 | | | | * | | John D. Kelly (11) | | | 9,386 | | | | | | H. Eugene Lockhart (12) | | | 22,160 | | | | * | | George E. Massaro (13) | | | 17,744 | | | | * | | John McCartney (14) | | | 57,155 | | | | * | | John S. Moody (15) | | | 19,653 | | | | * | | Diane E. Ratekin (16) | | | 39,957 | | | | * | | James H. Roth (17) | | | 380,291 | | | | 1.69 | | Hugh E. Sawyer (18) | | | 13,095 | | | | * | | Debra Zumwalt (19) | | | 12,283 | | | | * | | All directors and executive officers as a group (11 persons) (20) | | | 692,193 | | | | 3.08 | |
| * | Indicates less than 1% ownership. |
| (1) | The principal address for each of the stockholders, other than Wellington Management Group LLP, Van Berkom & Associates Inc., The Vanguard Group, Inc., FMR LLC, TimesSquare Capital Management, LLC, and BlackRock, Inc., Dimensional Fund Advisors LP, Boston Partners, and FMR LLC, listed below, is c/o Huron Consulting Group Inc., 550 West Van Buren Street, Chicago, Illinois 60607. |
| (2) | The principal address of Wellington Management Group LLP is 280 Congress Street, Boston, Massachusetts 02210. The shares are owned by Wellington Management Group LLP and the following subsidiaries of Wellington Management Group LLP: Wellington Group Holdings LLP, Wellington Investment Advisors Holdings LLP and Wellington Management Company LLP. Information regarding beneficial ownership of our common stock by Wellington Management Group LLP is included herein in reliance on a Schedule 13G/A filed with the SEC on March 10, 2016.February 8, 2018. |
| (3) | The principal address of Van Berkom & Associates Inc. is 1130 Sherbrooke Street West, Suite 1005, Montreal, Quebec H3A 2MB. Information regarding beneficial ownership of our common stock by Van Berkom & Associates Inc. is included herein in reliance on a Schedule 13G filed with the SEC on February 13, 2018. |
| (4) | The principal address of The Vanguard Group, Inc. is 100 Vanguard Boulevard, Malvern, Pennsylvania 19355. The shares are owned by The Vanguard Group, Inc. and the following subsidiaries of The Vanguard |
| Group, Inc.: Vanguard Fiduciary Trust Company and Vanguard Investments Australia, Ltd. Information regarding beneficial ownership of our common stock by The Vanguard Group, Inc. is included herein in reliance on a Schedule 13G/A filed with the SEC on February 11, 2016.9, 2018. |
(4)(5) | The principal address of BlackRock, Inc. is 55 East 52nd Street, New York, New York 10055. The shares are owned by the following subsidiaries of BlackRock, Inc.: BlackRock (Netherlands) B.V., BlackRock Advisors (UK) Limited, BlackRock Advisors, LLC, BlackRock Asset Management Canada Limited, BlackRock Asset Management Ireland Limited, BlackRock Asset Management Schweiz AG, BlackRock Financial Management, Inc., BlackRock Fund Advisors, BlackRock Institutional Trust Company, N.A., BlackRock Investment Management (Australia) Limited, BlackRock Investment Management (UK) Ltd. and BlackRock Investment Management, LLC. Information regarding beneficial ownership of our common stock by BlackRock, Inc. is included herein in reliance on a Schedule 13G/A filed with the SEC on January 25, 2018. |
| (6) | The principal address of Dimensional Fund Advisors LP is Building One, 6300 Bee Cave Road, Austin, Texas 78746. Information regarding beneficial ownership of our common stock by Dimensional Fund Advisors LP is included herein in reliance on a Schedule 13G/A filed with the SEC on February 9, 2018. |
| (7) | The principal address of Boston Partners is One Beacon Street, 30th Floor, Boston, Massachusetts 02108. Information regarding beneficial ownership of our common stock by Boston Partners is included herein in reliance on a Schedule 13G filed with the SEC on February 13, 2018. |
| (8) | The principal address of FMR LLC is 245 Summer Street, Boston, Massachusetts 02210. The shares are owned by FMR LLC and the following subsidiaries of FMR LLC: FIAM LLC, Fidelity (Canada) Asset Management ULC, Fidelity Institutional Asset Management Trust Company, FMR Co., Inc., and Strategic Advisers, Inc. Information regarding beneficial ownership of our common stock by FMR LLC is included herein in reliance on a Schedule 13G/A filed with the SEC on February 12, 2016.14, 2018. |
(5)(9) | The principal addressIncludes 4,355 shares of TimesSquare Capital Management, LLC is 7 Times Square, 42nd Floor, New York, New York 10036. Information regarding beneficial ownership of ourrestricted common stock by TimesSquare Capital Management, LLC is included herein in reliance on a Schedule 13G/A filed with the SEC on February 10, 2016.
|
(6) | The principal address of BlackRock, Inc. is 55 East 52nd Street, New York, New York 10055. The shares are owned by the following subsidiaries of BlackRock, Inc.: BlackRock Advisors, LLC, BlackRock Asset Management Canada Limited, BlackRock Asset Management Ireland Limited, BlackRock Asset Management Schweiz AG, BlackRock Fund Advisors, BlackRock Institutional Trust Company, N.A., BlackRock Investment Management (Australia) Limited, BlackRock Investment Management (UK) Ltd. and BlackRock Investment Management, LLC. Information regarding beneficial ownership of our common stock by BlackRock, Inc. is included herein in reliance on a Schedule 13G/A filed with the SEC on February 10, 2016.stock.
|
(7)(10) | Includes 3,484 shares of restricted common stock. |
(8) | Includes 13,71415,647 shares issuable upon exercise of options that are exercisable currently or within 60 days of the Record Date. Also includes 9,55556,459 shares of restricted common stock.
|
(9)(11) | Includes 3,4847,109 shares of restricted common stock. |
(10)(12) | Includes 3,4844,355 shares of restricted common stock. |
(11)(13) | Includes 3,4844,355 shares of restricted common stock. |
| (14) | Includes 4,355 shares of restricted common stock, as well as 1,259 shares held by a wholly-owned limited liability company of which Mr. McCartney is the sole owner. |
(12)(15) | Includes 3,4844,355 shares of restricted common stock. |
(13)(16) | Includes 11,4027,904 shares issuable upon exercise of options that are exercisable currently or within 60 days of the Record Date. Also includes 5,1928,775 shares of restricted common stock. |
(14)(17) | Includes 164,732160,746 shares issuable upon exercise of options that are exercisable currently or within 60 days of the Record Date. Also includes 22,37050,533 shares of restricted common stock, as well as 3,855 shares held by a family partnership.limited liability company. |
(15)(18) | Includes 4,3918,799 shares of restricted common stock. |
(16)(19) | Includes 4,355 shares of restricted common stock. |
| (20) | Includes an aggregate of 189,848184,297 shares issuable upon exercise of options held by members of the group that are exercisable currently or within 60 days of the Record Date. Also includes 58,928Date, as well as 157,805 shares of restricted common stock.stock held by the Directors and Executive Officers listed above. |
EXECUTIVE COMPENSATION Compensation Discussion and AnalysisCOMPENSATION DISCUSSIONAND ANALYSIS
The Compensation Discussion and Analysis provides information regarding the objectives and elements of our compensation program with respect to the compensation of persons who appear in the Summary Compensation Table (who we refer to collectively throughout this Proxy Statement as our “named executive officers” or “NEOs”). | | | SECTION 1 — EXECUTIVE SUMMARY | Huron is a global professional services firm focused on assisting clientscommitted to achieving sustainable results in partnership with their most complex business issues by delivering high-value, quality solutionsits clients. The company brings depth of expertise in strategy, technology, operations, advisory services and analytics to support their long-term strategic objectives. Huron specializes in serving clientsdrive lasting and measurable results in the healthcare, higher education, life sciences and commercial sectors as these organizations face significant transformational changesectors. Through focus, passion and regulatory or economic pressures in dynamic market environments. With its deep industry and technical expertise,collaboration, Huron provides advisory, consulting, technology,guidance to support organizations as they contend with the change transforming their industries and analytic solutions to deliver sustainable and measurable results.businesses. Named Executive Officers This past year,During 2017, Huron’s named executive officer team consisted of the following individuals:
• Mr. Roth, Chief Executive Officer, President and Director. • Mr. Hussey, Executive Vice President and Chief Operating Officer,Officer.1 •Mr. Kelly, Executive Vice President, Chief Financial Officer and Treasurer.1 • Ms. Ratekin, Executive Vice President, General Counsel and Corporate Secretary. Huron’s named executive officers are responsible for our Company-wide business operations and setting overall strategy of the organization. ConsultingPractice Leadership
Each of Huron’s operating segments is led by Practice Leadership and teams of client-facing managing directors. The Practice Leaders and client-facing managing directors for each business area are responsible for the financial results of their respective business area, including revenue and EBITDA growth, while ensuring delivery of superior services.solutions. These leaders have the critical talent and skills that make us unique and enable us to grow our business and compete in the marketplace. It is imperative to our core business strategy that we motivate and retain our current client-facing managing directors and obtain new talent through recruiting and developing our high potential employees so that they can progress to higher level leadership roles within the Company. | | Business Strategy | Business | | Compensation | Our business strategy is to be the premier professional services firm specializingtransformation partner to our clients. Through our integrated capabilities, we help organizations own their future in the healthcare, education, and life sciences markets while providing complementary financial advisory and technology services to these core vertical markets as well as the commercial sector.face of rapid change. To ensure the success of our strategy and our ability to deliver sustained value to our shareholders, Huron focuses on the following key drivers: • Specialize in enabling organizations to lead through transformational change by providing integrated offerings built on the strength of our industry knowledge. • Deliver high-value, quality client serviceservices to our clients to support their comprehensive needs, from strategy setting to implementation.execution. • Broaden and strengthen our capabilities to continue to best serve our clients while maintaining and growing our strong industry expertise. • Specialize in offering deep industry specific consulting expertise to our healthcare, education, and life sciences clients. • Attract, retain, and motivate top tier client-facing employees who have substantialwith diverse perspectives and experience levels, including subject matter and/or technical expertise.
• Supplement organic growth by successfully identifying, executing and successfully integrating acquisitions that expand or complement our current market offerings.offerings and deepen our industry expertise or broaden our capabilities to best serve our clients’ needs. • Optimize our corporate infrastructure to effectively scale and support the Company’s long-term growth plans, while enhancing EBITDA margins. |
| 1 | On January 3, 2017, Mr. John Kelly was promoted to the position of Executive Vice President and Chief Financial Officer (“CFO”). Formerly, Mr. Kelly had been Corporate Vice President and Chief Accounting Officer. With Mr. Kelly assuming the CFO role, Mr. Hussey has transitioned this role and has become Executive Vice President and Chief Operating Officer. Mr. Hussey also assumed the interim role of Healthcare Practice Leader. |
| | | | Compensation Strategy | Our compensation plan philosophy has three key elements: • Motivate and reward performance in the long-term best interests of shareholders. • Deliver competitive total compensation generally targeted at the median of the peer group(+/-15%). • Place a substantial portion of the compensation of our named executive officers at risk; actual payouts should vary based on the Company’s financial and operational performance. The performance measures directly link into our business strategy through revenue,net revenues, Adjusted EBITDA margin, and Adjusted Diluted EPS growth as well as fulfillment of strategic measures identified each year by the board of directors. As a result, weWe annually grant a sizeablesizable portion of equity to our managing directors (andirectors. An average of 83% of total equity granted in each of the last three years; by contrast, approximately 10%80% of total equity granted in the pastlast three years iswas awarded to NEOs).our managing directors with the balance awarded to NEOs, other employees and directors. As a professional services firm, we recognize that our managing directors are critical to developing and maintaining client relationships, generating revenue and todriving the overall success of Huron. We use stock as both a retention tool and an incentive to incentencourage behaviors that will benefit the shareholders as well asand the Company as a whole.Company. Approximately 50% of the annual bonus compensation of our Practice Leaders and client-facing managing directors consists of restricted stock that vests over four years.years, and is awarded based on prior year performance. We believe this element of our compensation aligns the interests of each of our individual practices with the Company as a whole and significantlyimportantly differentiates Huron’s compensation program from our competitors’ programs, because of the amount of equity provided below the NEO level.by aligning our managing directors with Huron’s long-term value creation.
|
1 | On February 25, 2016, Mr. Hussey transitioned the role of Treasurer to John D. Kelly, Huron’s Chief Accounting Officer.
|
| Business Actions and Results | To understand our compensation decision making, it is important to understand the
The Company’s financial strategic and other objectivestrategic performance during 2015. During 2015, we evaluated2017 determine the evolving strategic needsmajority of the Legal business and concluded that we would be challenged to provide the investments necessary to be responsive to the face of a changing market and to achieve the practice’s growth objectives. As a result, we determined that the practice would be better aligned with a new partner. We divested the Legal business and sold the practice to Consilio, Inc. on December 31, 2015. Going forward, we will maintain our strategic focus on the Company’s remaining core businesses of Healthcare, Education and Life Sciences, and Business Advisory. Due to the divestiture, the results of the Huron Legal segment have been reclassified as discontinued operations. To provide comparable historical results and a meaningful basis with which to evaluate the Company’s future prospects, all financial information throughout this Proxy Statement is presented on a continuing operations basis, unless otherwise noted.NEO’s compensation.
Business results were as follows2: We define success through
• Our 2017 financial results came in lower than we expected, driven by further softness in our Healthcare business. The decline in Healthcare was partially offset by growth in our Education and Business Advisory segments. • Net revenues were $732.6 million in 2017, compared to $726.3 million in the prior year. • Adjusted EBITDA decreased 19.3% to $104.6 million in 2017, or 14.3% of net revenues, compared to 17.9% in the prior year. • Adjusted diluted EPS was $2.15 in 2017, a number of measures, and in 2015 we had a mixed performance33.0% decrease from the prior year. • While we delivered results that were lower than our initial guidance, we undertookhave made significant progress in the operational turnaround of our Healthcare business positioning us to be more responsive to changing market conditions. Among other initiatives, we have enhanced the level of collaboration across all of our service lines. Our efforts have better equipped the Healthcare business to compete across a wider spectrum of engagement sizes and durations by developing more flexible delivery models.
• We also completed two significant strategic initiatives – the large acquisition of Studer Groupacquisitions in 2017. We acquired Innosight and Pope Woodhead in the healthcare segment,first quarter, strategically adding to our Business Advisory segment. We believe these acquisitions strengthen our strategy capabilities and the divestitureprovide us with a comprehensive set of the Legal business, that we believe position Huron for success in 2016. • Net revenues of $699.0 million, 11.4% higher than the prior year.
• Adjusted EBITDA increased 25.9%offerings to $139.3 million, or 19.9% of net revenues comparedserve our clients—from strategy setting to 17.6% in the prior year.
• Adjusted diluted EPS of $2.99, a 22.0% increase over the prior year.
• Completed threeexecution. These acquisitions that in the aggregatealso strengthen our international footprint to best serve our growing, global client base. These acquisitions contributed over $81almost $44 million in revenues during 2015.2017 and performed largely as planned.
• Reorganized corporate infrastructure to align with business expectation In 2017, we defined our new, five-year enterprise-level strategy, created a unified sense of purpose and to gain efficiencies, resulting in $11 million in identified cost reductions to lower SG&A expense. • Maintainedsecured the commitment of our employees through a strong balance sheet while funding more than $408 million in acquisitionsnew vision, mission, set of values and other investments, share repurchases and capital expenditures.
• Generated cash flow from operations of $164 million enabling the Company to reduce its leverage ratio, defined as total debt, net of cash, divided by Adjusted EBITDA to 2.1x as of December 31, 2015.
| Compensation Program Actions
| The Compensation Committee took several compensation actions beginning in 2014 to better align the compensation plan with our business strategy and shareholder interests.
• In 2014, added a three-year performance measurement period to performance shares to align multi-year performance and long-term compensation; 2015 marks the second year of the three-year performance measurement period.
• In 2014, replaced stock options with restricted share awards (RSAs) in the service-based equity portion of the Long-Term Incentive Planmodified brand positioning all designed to align with our peer group andstrategy.
• We continued to balancealign our corporate infrastructure with the risk profileevolving needs of our compensation program given the addition of a three-year performance factor in the performance share plan.business to gain efficiencies and leverage our SG&A expense. • In 2014, introduced a clawback policy to safeguard against unwarranted compensation in the event of a financial restatement.
• In 2015, revised the peer group to include more companies with similar revenue and business characteristics to Huron.
|
22 | In the below discussion of the Company’s 20152017 performance, the Compensation Committee discusses certain of Huron’s results of operations using certain non-GAAP financial measures, which are discussed in the Company’s Annual Report on Form10-K for the year ended December 31, 20152017 (the “2015“2017 Annual Report on Form10-K”), Item 7, Management’s Discussion and Analysis of Financial Condition and Results of Operations under the subheading “Non-GAAP“Non-GAAP Measures.” Thesenon-GAAP financial measures include Adjusted EBITDA, Adjusted EBITDA margin, Adjusted net income, and Adjusted diluted EPS. EBITDA is defined as net income (loss) from continuing operations before interest, and other expenses, income tax expense and depreciation and amortization. Adjusted EBITDA represents EBITDA as adjusted by adding back restructuring charges, goodwill impairment charges, other gains and litigationlosses,non-operating income and otherexpense, and foreign currency transaction gains and losses. Adjusted EBITDA margin is Adjusted EBITDA expressed as a percentage of net revenues. Adjusted diluted EPS is defined as diluted earnings (loss) per share from continuing operations adjusted forby adding back the same items as Adjusted EBITDA, in addition to amortization of intangible assets, and non-cash interest on convertible notes, all on a tax effected basis, as well as nettax expense related to the enactment of Tax Cuts and Jobs Act of 2017 and tax benefit related to the Company’s “check-the-box” elections.“check-the-box” election. |
| Impact of Results on NEO Compensation |
2013 to 2015Our NEO compensation relies heavily on performance-based pay – the annual and long-term incentive programs. The Compensation Decision MakingCommittee establishes challenging goals that reflect the Company’s goals and business environment. The pay our NEOs ultimately earn is based on the level of achievement of these performance goals and our stock price performance.
ForTarget total compensation purposes, five key metrics determinefor our CEO in 2017 was 80% “at risk”, meaning that it is contingent upon and based on Company performance and stock price performance, and the valuetarget total compensation for our other NEOs was on average 69% “at risk”.
NEO Pay Mix (Target) 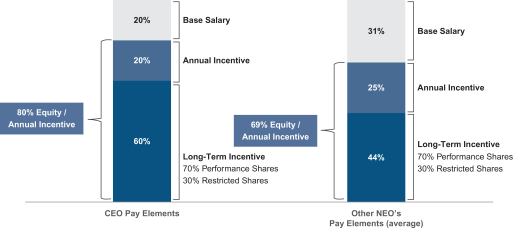
Our performance in 2017 against the predetermined goals did not meet our expectations, which resulted in a small portion of our incentive programNEO’s target compensation that was “at risk” being earned. The pay actually earned by our CEO and other NEOs, compared to our NEOs. The Committee believes that the results of the last three years show a strongtarget, is shown below. NEO Pay Mix (Actual) 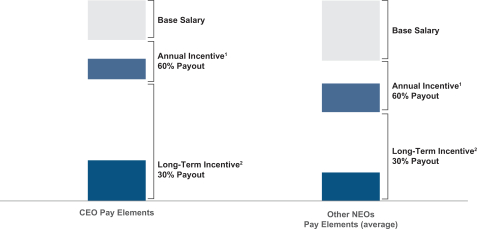
| (1) | The 2017 annual incentive award paid out at 60.2% of target. |
| (2) | The value of the 2017 long-term incentive reflects both a lack of payout on the Adjusted EPS component and the decline in our share price, with earned shares valued at the 12/31/17 price of $40.45. |
Our pay programs create alignment between Company performance and NEO pay, as illustrated for the prior three years in the tables below. Our annual incentives yielded payouts below target in each of those years, and our long-term incentive program has only provided a payout in one year, but at a below target level. 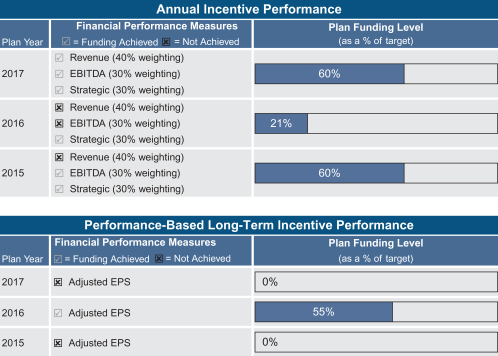
Our executive compensation programs are very aligned with shareholder value. This is reflected in a comparison of Mr. Roth’s target and realizable compensation. The graph below illustrates the target compensation opportunity provided to Mr. Roth for 2015-2017 compared to the NEOs. The resultsactual value realized, when taking into account performance achievements under our incentive programs as well as share price changes. Mr. Roth realized 56% of our key metrics and impact on our compensation programs for 2013 to 2015 were:his target pay opportunity over the 2015-2017 period. 3-Year Aggregate CEO Pay ($000s) (2015-2017) 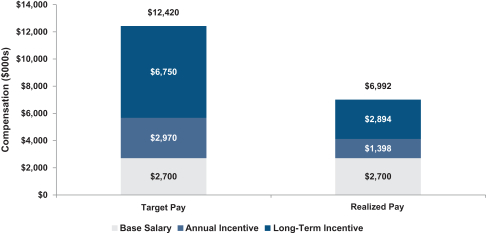
| | | | | 2015 | Plan and Metric | | Performance | | Payout Result | Annual Incentive Plan
• Revenue (40% Weight)
• Adjusted EBITDA Margin (30%)
• Strategic Measures (30%)
| (1) | Revenue – Below threshold, 0% funding
Margin – At target, 100% funding
Strategic measures – 100%
| | After applying weighting:
2015 annual incentive payout was 60% of target
| Performance Shares (Annual Component)
• Non GAAP EPS (100% weighting)
| | EPS – Below threshold, 0% funding
| | Due to performance, 0%Target Pay reflects the sum of the performance shares were earned fortarget compensation levels in each of 2015,
| Stock Price
| | Declined 13%
| | Lowered value of unexercised stock options, unvested restricted stock 2016 and performance shares2017.
|
| | | | | 2014 | Plan and Metric | | Performance | | Payout Result | Annual Incentive Plan
• Revenue (40% Weight)
• Adjusted EBITDA Margin (30%)
• Strategic Measures (30%)
| (2) | Revenue – 98%Realized Pay reflects the sum of target, 73% funding
Margin – Above maximum, 125% funding
Strategic measures – 100%
| | After applying weighting:
2014actual base salary paid, actual annual incentive payout was 97% of target
| Performance Shares (Annual Component)
• Non GAAP EPS (100% weighting)
| | EPS – Above maximum, 125% funding
| | Due to performance, 125%earned and long-term incentive award value for awards granted in 2015, 2016 and 2017. The value of the long-term incentive reflects actual performance shares were earned for 2014
| Stock Price | | Increased 9%
| | Raised value of unexercised stock options, unvested restricted stockcompleted performance periods and target performance sharesfor outstanding performance cycles, with all awards valued at the $40.45year-end share price.
|
| | | | | 2013 * | Plan and Metric | | Performance | | Payout Result | Annual Incentive Plan
• Revenue (40% Weight)
• Adjusted EBITDA Margin (30%)
• Strategic Measures (30%)
| | Revenue – 99% of target, 96% funding
Margin – Above maximum, 125% funding
Strategic measures – 100%
| | After applying weighting:
2013 annual incentive payout was 106% of target
| Performance Shares
• Non GAAP EPS (100% weighting)
| | EPS – Above maximum, 125% funding
| | Due to performance, 125% of the performance shares were earned for 2013
| Stock Price | | Increased 86%
| | Raised value of unexercised stock options, unvested restricted stock and performance shares
|
* Due to performance being above maximum in both EPS and EBITDA margin in 2013, the Committee approved a supplemental cash award to the NEOs. Details of this supplemental award are disclosed in the 2014 proxy filing for the 2013 fiscal year.
| Peer Groups | We evaluate several groups of peers depending on what we are measuring:
• For executive compensation, we use a peer group of publicly traded companies where the roles of the executive officers are similar to those of our executives (see Section 4 for more detail). We set executive pay in alignment with the pay data from this peer group. For compensation of our client-facing managing directors as referenced above, we gather data from public and private companies and focus our comparators on the type of work performed, rather than the size or public/private nature of the organizations.
• In order to assess our business performance, we review all of our business competitors, many of which are private, much larger in size or are subsets of larger companies. As a result, obtaining comparative business results can be challenging. We review the best available information from the companies we compete with for business.
The complexity of the business composition of our peer group makes obtaining comparable performance data difficult. As a result, we have chosen to set executive performance goals based on absolute rather than relative performance measures.
|
| | SECTION 2 - COMPENSATION PROGRAM OVERVIEW |
Huron’s executive compensation program is structured to align executive pay with Company performance. The strength of this alignment was recognized by our shareholders in 20152017 as Huron received over 99% approval of asupport on our shareholder advisory vote on executive compensation (commonly referred to as “Say on Pay”). We strive to provide compensation to motivate and reward performance that is in the long-term best interests of our shareholders. We define performance as a blend of: Achieving financial performance in comparison to annualpre-established financial goals (net revenue and adjusted EBITDA margin) Attaining critical annual strategic initiatives that we believe are critical to future value creation Delivering value to shareholders (adjusted diluted EPS measured annually As part of the program, we also evaluate several groups of peers depending on what we are measuring: For executive compensation, we use a peer group of publicly traded companies (“Executive Pay Peer Group”) where the size of the companies and overthe roles of the executive officers are similar to those of Huron. We generally seek to target executive pay at the market median and in alignment with the pay data from this peer group. This pay data may at times be supplemented with broader survey data for specific executives, as appropriate. For compensation of our client-facing managing directors (“Managing Director Peer Group”), we gather data from public and private companies and focus our comparators on the type of work performed, rather than primarily on the size or public/private nature of the organizations. In order to assess our business performance, we review our business competitors, many of which are private, much larger in size or are subsets of larger companies. Therefore, obtaining comparative business results can be challenging. As a three-year period)result, we have chosen to set executive performance goals based on absolute rather than relative performance measures. In addition to these objectives, we adhere to a comprehensive set of generally accepted best practices in the structuring and design of the compensation program. | | | Best Practice Elements: | • | | Establish Competitive Compensation Levels.We target the total direct compensation for our named executive officersNEOs at levels that are competitive versus our peer group — keeping total direct compensationgenerally within +/- 15% of peer groupmarket median total direct compensation levels.levels and tie actual compensation to performance. | • | | Maintain a “Double Trigger.” OurIn the event of a change of control, arrangements provide benefits on a “double trigger,” meaning that the severance benefits are paid, and equity awards vest, only if our executivesNEOs incur a qualifying termination in connection with a change of control.termination. | • | | Minimize Compensation Risks.We periodically review our compensation program to confirm that our compensation policies and practices are not encouraging excessive or inappropriate risk taking by our NEOs. Potential incentive payouts are capped and we conduct a risk assessment of all compensation plans annually. In addition, NEO LTI does not increase if driven by share repurchases that were not factored into the annual plan. | • | | Impose Robust Stock Ownership Guidelines.Our stock ownership guidelines require our NEOs to achieve robust ownership requirementsretain a significant equity stake in the Company. NEOs are expected to retain a number of shares equal to at least 60% of the net after tax value from the exercise of stock options or vesting of restricted shares and executivesperformance shares until these guidelines are not allowed to sell Huron securities (except to pay taxes) until they reach the requirements.met. | • | | Maintain a “Clawback” Policy.Policy. We maintain a compensation recoupment policy (commonly referred to as a clawback policy)“clawback policy”), which generally provides that the Company may recover performance-based compensation paid to executive officersNEOs and such other individuals designated by our independent directors, if payout was based on financial results that were subsequently restated. The policy supports the accuracy of our financial statements and helps to align the interests of our executive officers with those of our stockholders. We also retain the right to cancel outstanding equity awards and recover realized gains if executives engage in certain “harmful activity,” such as violating a non-competition or non-solicitation covenant. | • | | Retain an Independent Compensation Consultant.Consultant. The Compensation Committee retains an independent consultant to assist in developing and reviewing our executiveNEO compensation strategy and to confirm that the design and pay levels of our compensation programs are appropriately consistent with our goals and market practices. | • | | Consider the Impact of Tax and Accounting Rules.Rules. The Compensation Committee takes into account the effect of tax and accounting rules in structuring our executiveNEO compensation program. For example, all ofThe Compensation Committee reserves the elements of the incentive-basedright to pay compensation to our NEOs (annual incentive plan, restricted stock plan and performance stock unit plan) are designed to qualify as performance-based compensation for purposes ofthat may not be deductible under Section 162(m) of the Internal Revenue Code and thus generally are intended to be fully deductible for federal income tax purposes.. | • | | Review Share Utilization.Utilization. We regularly review overhang levels (the dilutive impact of equity awards on our shareholders) and burn rates (the aggregate shares awarded as a percentageconsider such levels in our consideration of total outstanding shares), and our goal continues to be to maintain burn rate levels below our committed burn rate of 4.37% for the 2015 to 2017 period.future equity grants. | • | | No Excise Tax Gross-Ups.Gross-Ups. Our NEOs are not entitled to receive any “gross-up”“gross-up” payments related to excise taxes that may be imposed in connection with golden parachute arrangements under the Company’s change of control severance plan. | • | | Hedging or Pledging of Company Stock.Stock. The board has adopted a policyrevised Insider Trading Policy that requires board approval of any hedging activities by executive officers, and the board has indicated it would not approve any such hedging activities except in unusual circumstances. The Company also has a pledging policy that, in general, prohibits directors, officers, employees, and contractors from hedging activities, holding Company securities in a margin account or pledging Company securities as collateral for a loan. Limited exceptions may be made by the General Counsel if the person wishes to pledge Company securities as collateral for a loan (not including margin debt) and clearly demonstrates the financial capacity to repay the loan without resort to the pledged securities. | • | | No “Timing” of Equity Grants.Grants. We maintain a disciplined equity approval policy. We do not grant equity awards in anticipation of the release of material,non-public information. Similarly, we do not time the release of material,non-public information based on equity grant dates. | • | | No Executive Perquisites.Perquisites that are not provided widely at Huron. We do not provide material benefits or perquisites to our NEOs that are not provided widely within Huron. |
The key operational aspects of our compensation program are summarized in the following table:
| | | | | Dimension of Program | | Description | Total Compensation Opportunity | | We generally strive to establish targets for total direct compensation within 10% to 15% of the peer group median. Target total direct compensation includes base salary, annual incentive compensation and long-term incentive (LTI) awards. Total actual compensation received by our named executive officers depends on Company performance.
| Compensation Vehicles
| | We rely on base salary, annual cash incentive, service-based equity, and performance shares.
| | | Base salary | | Reflects the fundamental role of the executive.
| | | Annual cash incentive | | Rewards for achieving specific key measures of short-term Company performance.
| | | Service-based equity (restricted stock) | | Serves to retain talent, promote executive ownership, and balance risk in the compensation portfolio. This component makes up 30% of the total target LTI award.
| | | Performance shares | | Aligns executive pay opportunities with long-term Company performance. If performance is below the minimum annual threshold, no awards will be earned. This component makes up 70% of the total target LTI award.
| Performance Metrics
| | Goal Setting | | Significant rigor is put into the determination of the Company goals. The Compensation Committee and the board carefully review goals submitted by management. Goals are set based on the Company’s financial plans taking into consideration shareholder expectations for growth and profitability.
Performance metrics on both the Annual Incentive Plan and the performance share plan are set such that zero awards are earned if the annual performance is below a minimum threshold level.
| | | Annual Incentive Plan | | | Revenue | | Reflects the Company’s commitment to growth through continued expansion of its service offerings and market presence. | | | Adjusted EBITDA Margin Percentage | | Aligns with Company’s focus on profitable growth. | | | Strategic Measures | | Reinforces the importance of achieving specific initiatives that are necessary for continued success. | | | Long-Term Incentive Plan | | | Performance Shares: Non-GAAP Adjusted Diluted EPS | | Ensures that the named executive officers are focused on profitability for shareholders over the multi-year performance period. The final value of the performance shares will also reflect the changes in the stock price, aligning the interests of the named executive officers with the shareholders.
| | | Service-based Equity: Stock Price | | The value of the service-based equity to the executive is a function of stock price performance during the vesting period and helps align the interests of the executives with the interests of shareholders.
|
| | SECTION 3 - COMPENSATION PROGRAM DETAILS |
Targeting of Total Direct Compensation The Compensation Committee generally targets total direct compensation within 10% to 15%be within+/-15% of the median of the peer groupExecutive Pay Peer Group for all named executive officers. It is the assessment of theour NEOs. The Compensation Committee thatalso reviews data from the total direct compensation levels of our named executive officers, including our CEO, are generally withinRadford Group Technology Survey for companies with annual revenue between $500M and $999.9M. This data informs the median of our peer group. The established targets for individual components and overall executive compensation are designed to be competitive in order to attract, motivate and retain executives necessary to drive and achieve Company objectives. In some cases, individual components may be over or under market (in order to emphasize a particular element or if individual circumstances dictate), but we believe the total direct compensation packages are market competitive.Committee’s decisions on pay adjustments. 20152017 Base Salary, Annual and Long-Term Incentive Changes
TheDuring 2017, the Compensation Committee made noapproved changes to base salaryboth the 2017 Annual and target annualLong-Term Incentive Plans. These changes were made with the goal of continuing to evolve and LTI levels forimprove the named executive officers for 2015 comparedprograms with the organizational needs of the Company, while ensuring a clear correlation between pay and performance, and effectively motivating the NEOs to 2014.
| | | | | | | Compensation Element | | James H. Roth | | C. Mark Hussey | | Diane E. Ratekin | Base Salary | | $900,000 | | $550,000 | | $400,000 | Target AIP Payout | | 110% of base
salary | | 90% of base
salary | | 50% of base
salary | Target LTI Payout | | 225% of base
salary | | 125% of
base salary | | 90% of base
salary |
out-perform expectations. The Compensation Committee approved 20162017 compensation levels (base salary and target annual and long-term incentive). No change was made in February of 2017. | | | | | | | | | | Compensation Element | | James H. Roth | | C. Mark Hussey | | John D. Kelly | | Diane E. Ratekin | Base Salary | | $900,000 | | $750,000 | | $325,000 | | $400,000 | Target AIP Payout | | 110% of base salary | | 100% of base salary | | 70% of base salary | | 50% of base salary | Target LTI Payout | | 300% of base salary | | 175% of base salary | | 100% of base salary | | 115% of base salary |
For 2017, the Compensation Committee increased Mr. Hussey’s base salary to $750,000 from $600,000 to recognize his performance, his leadership role in the creation of Huron’s long-term strategy, and his increased role leading the transformation of the Healthcare practice. They also increased Mr. Roth’s compensation.target LTI to 300% from 225% and Ms. Ratekin’s target LTI to 115% from 100% to be more market competitive, and increased Mr. Hussey’sKelly’s total compensation by 105% to compensate for his promotion to Chief Financial Officer from Chief Accounting Officer. For 2018, the Compensation Committee increased Mr. Kelly’s total compensation by 32% to be more market competitive. His salary was increased 30% in totalfrom $325,000 to reflect$400,000 and his performance and increased responsibilities related to his role as Chief Operating Officer. Ms. Ratekin’s compensationLTI was increased 4% in totalfrom a target of 100% to maintain her compensation at competitive levels.120%. | | | | | | | Compensation Element | | James H. Roth | | C. Mark Hussey | | Diane E. Ratekin | Base Salary | | $900,000 | | $600,000 | | $400,000 | Target AIP Payout | | 110% of base
salary | | 100% of base
salary | | 50% of base
salary | Target LTI Payout | | 225% of base
salary | | 175% of
base salary | | 100% of base
salary |
20152017 Annual Incentive
The Compensation Committee approved a performance-based Annual Incentive Plan for 2015.2017. The maximum incentive opportunity for 2017 increased from 125% to 150% of target to better align with market practice and to enhance the incentives for participants to achieve maximum performance levels. Based on the actual results on each of the performance measures, a total annual cash annual incentive payout of 60% of target was earned. This amount is reflected in the Summary Compensation Table asNon-Equity Incentive Plan Compensation. This plan has three performance criteria (withis structured as shown in the corresponding weight noted below):table below: | 1. | Revenue (40% weighting). Net revenues for 2015 including discontinued operations were $838.4 million which was below the target level and resulted in a 0% funding for this component. Revenues generated by the acquisitions completed in 2015 that were not included in the NEO revenue target established at the beginning of 2015 are excluded for purposes of measuring performance.
|
| | | | | | | | | | | | Performance Measure | | Weighting | | Threshold | | Target | | Maximum | | Actual | Net Revenue | | 40% | | $729M | | $759M | | $829M | | $733M | Adjusted EBITDA Margin | | 30% | | 14.3% | | 15.2% | | 16.0% | | 14.3% | Strategic Measures* | | 30% | | Committee Discretion | | 100% | | 150% | | 125% |
| 2. | Adjusted EBITDA Margin Percentage (30% weighting). Actual Adjusted EBITDA margin percentage including discontinued operations of 20.0% resulted in 100% funding for this component.
|
| 3. | Strategic Measures (30% weighting). The measures that were approved by the Compensation Committee at the beginning of 2015 focused on further development of each practice area* The Committee reviewed and discussed the NEOs’ performance against the strategic measures that were established at the beginning of the year. The Committee identified overachievements against certain objectives and further improvements in the effectiveness and efficiencies of Huron’s infrastructure. In considering the specific performance against each of the strategic measures, the Compensation Committee concluded that the executives met or exceeded performance on several measures including: best performance to date in Education and Life Sciences and legacy Business Advisory segments, the completion of the Huron Legal divestiture, the successful completion of one of our largest acquisitions in the healthcare segment, the development of senior level succession plans, and the successful scaling of corporate infrastructure. This offset the shortfall in results in the Healthcare business. After considering the performance in all areas, the Compensation Committee determined that this performance should result in funding of 100% of target.
|
Based on these results, the overall level of performance resulted in a payout underon the Annual Incentive Plan was 60%strategic measures of 125% of target.
Note: A performance threshold of $0.05 GAAPAdjusted Diluted EPS which must be exceeded prior to the payout of the 20152017 Annual Incentive Plan is designed to comply with the terms of Section 162(m). If $0.05 GAAPAdjusted EPS is exceeded, the Compensation Committee can approve a payout of up to 150% of target. The $0.05 GAAPAdjusted Diluted EPS was exceeded in 2015.2017. The chart below shows the plan structure, the results of each performance measure and the calculation of the annual incentive award.
| | | | | | | | | | | | | | | | | | 2015 Performance Targets ($MM) | | | Measure | | Weight | | 25% | | 100% | | 125% | | Actual | | % Earned | Net Revenues, including discontinued operations | | 40% | | $880 | | $925 | | $940 | | $838.4 | | 0% | Adjusted EBITDA %, including discontinued operations | | 30% | | 19.8% | | 20.0% | | 20.2% | | 20.0% | | 100% | Strategic Measures | | 30% | | See above | | 100% | Total Earned: 60% | | | | | | | | | | | | |
20152017 Long-Term Equity Grants
On March 1, 2015,15, 2017, Huron grantedmade long-term equity grants that were structured as 70% performance sharesunits and 30% restricted stock.shares. | Executive | | Performance
Shares
Granted* | | Restricted
Shares
Granted | | Performance Units
Granted* | | | Restricted Shares
Granted | | James H. Roth | | 21,268 | | 9,115 | | | 46,210 | | | | 19,804 | | C. Mark Hussey | | 7,221 | | 3,095 | | | 22,463 | | | | 9,627 | | John D. Kelly | | | | 5,562 | | | | 2,384 | | Diane E. Ratekin | | 3,781 | | 1,620 | | | 7,873 | | | | 3,374 | |
| * | Full long-term equityperformance unit grant value at target performance. |
In August of 2017, the Compensation Committee awarded Mr. Hussey an award of restricted shares with a grant date fair value of $1,000,000 in order to recognize his contributions as the interim leader of the Healthcare practice during its ongoing transformation as well as his critical role to the ongoing success of the business. Restricted Stock Awards The restricted stock granted willto our NEOs vest 25%1/3 per year over fourthree years, based on continued service to ensure continued retention. In addition, the Company must exceed $0.05 per share ofAdjusted EPS in the year of grant for vesting to occur overor the four years based on service.awards will be forfeited. This condition is designed to satisfy the conditionsprovisions of Section 162(m). This condition was met in 2015.2017. Performance Share Awards In 2014, the Compensation Committee revised theThe performance share plan for named executive officers.awards are tied to both three-year performance and annual performance. The performance share plan is now based on bothwas redesigned for 2017, following the completion of the initial three-year performance (2014 through 2016)cycle (2014-2016). The 2017 performance share plan maintains theone-year performance period (60% of award) and annual performance. The purpose of revising the plan to add a three-year performance period was to incent sustained(40% of award). Theone-year performance is measured 100% based on 2017 Adjusted Diluted EPS and any earned shares will vest ratably over a longer-termthree years. The new three-year performance period and to better align overall compensation with total shareholder return. This replaces the 2013 design that was based 100 percent on annual performance; 2015 marks year two of the revised program.
Plan Mechanics:
A grant of performance share units was made in 2014 and 2015. An additional grant will be made in early 2016measured 100% based on each NEO’s target LTI payout.
Each grant is assessed using both annual2019 Adjusted Diluted EPS, and three-year performance goals.
| ¡ | | Annual Performance. At the start of each year, the Compensation Committee approves annual performance goals and sets threshold, target and maximum performance levels based on Non-GAAP Adjusted EPS.
|
| ¡ | | Three-Year Performance. Three-year performance is assessed using the three-year average of the actual annual performance achievement against the annual goals. The three-year average of the annual performance for 2014-2016 will result in a multiple to be applied to the portion of the awards subject to the three-year performance, based on a table developed by the Compensation Committee as shown in the chart below with the heading “Multiplier for 2014-2016 Three-Year Average Performance.”
|
Atany earned shares will immediately vest on March 15, 2020, after the end of the annual performance period, performance is evaluated on the annual performance goals and all performance share units are adjusted based on performance against the annual goals.
The grant is then divided into two parts:
| ¡ | | 40% of the adjusted award is deemed to be earned based on the annual performance and vests immediately.
|
| ¡ | | The remaining 60% of the award will remain unearned and is subject to an additional adjustment based on three-year performance.
|
At the end of 2016, three-year performance will be determinedperiod. Payout opportunity remains 50% of target for threshold performance and applied to the 60%200% of the award that was deferred at the end of the annualtarget for maximum performance. No shares are earned for performance periods and adjusted based on the table shown below.below threshold.
| ¡ | | 50% of the earned amount (30% of the total award) will vest at the end of 2016.
|
| ¡ | | 50% of the earned amount (30% of the total award) will vest at the end of 2017.
|
20152017 Annual Performance Measures and Results:
The Compensation Committee established Non-GAAP Adjusted Diluted EPS as the performance measure for PSUs with payouts ranging from 0% to 125%200%. Actual performance including discontinued operations, came in at less than 0% ofbelow the target;threshold; therefore, the grant of performance share units was adjusted to 0%were not earned as presented in the chart below. | | | | | | | | | | | | | | | | | | | | | | | | | | | | 2015 Performance Targets(1) | | | Actual Performance | Measure | | 0% | | | 25% | | | 100% | | | 125% | | | Actual | | | PSU
Adjustment
Percent | | Actual Earned
Amount for 3 Yr.
Avg. | Non-GAAP Adjusted EPS | | <$ | 3.80 | | | $ | 3.80 | | | $ | 4.00 | | | $ | 4.20 | | | $ | 3.53 | | | 0% | | 84% |
| | | | | | | | | | | | | | | | | | | | | | | | | | | | | | | | | | | | 2017 Performance Targets (1) | | | | | | Actual Performance | | | Measure | | 0% | | | 25% | | | 100% | | | 150% | | | | | | 200% | | | Actual | | | PSU
Earned
Percent | | Adjusted Diluted EPS | | <$ | 2.31 | | | $ | 2.31 | | | $ | 2.46 | | | $ | 2.76 | | | | | | | $ | 3.16 | | | $ | 2.15 | | | | 0 | % |
| (1) | Actual Non-GAAP Adjusted Diluted EPS is calculated on a consolidatedcontinuing operations basis including discontinued operations and also excludes the impact of share repurchases made subsequent to the establishment of the performance target and certain acquisitions completed in 2015.2017. |
Three-Year Performance Measures:2018 NEO Compensation Program Design Changes
Three-year performance will be measured usingDuring 2017, we undertook a three-year averagereview of the earned performance from 2014, 2015our NEO compensation program to ensure it continues to support our business and 2016. This three-year average will use the actual earned amount from the annual performance cycles. talent strategies, appropriately reflects peer practices, and aligns with shareholders in recognition of our ongoing transformation.
Based on that average,this review, the Committee approved a multiplier between .75 and 2.0 is applied (see chart below). For 2014,number of changes to the actual performance of 151% will be used in the average. For 2015, the actual performance of 0% will be used in the average.NEO compensation program for 2018: | | | | | | | | | | | | | Multiplier for 2014 – 2016 Three-Year Average Performance (1) | | .75 | | .9 | | 1.0 | | 1.25 | | 1.5 | | 1.75 | | 2.0 | < 50% | | 50% to 84% | | 85% to 99% | | 100% to 109% | | 110% to 114% | | 115% to 119% | | ³120% |
(1) | | | | 2018 Annual Incentive Program | | Changes Made: | | Reasons for Change: | • Adding organic revenue growth as performance measure, replacing the budgeted revenue goal. • Adding greater specificity to and limiting the number of strategic objectives. • Widening the performance/payout range. | | This multiplier table starts at .75 because
• Creates enhanced emphasis on the target awards were already adjusted subjectimportance of top line growth in growing share price. • Provides greater clarity to annualperformance expectations and reduces subjectivity in assessing performance. • Better reflects competitive practices while maintaining our performance focus by providing lower than typical payout for below target performance and areby requiring greater performance for a maximum payout. |
The 2018 annual incentive program design is summarized below: | | | | | | | | | | | | | | | | | | | | | | | | | | | | | | | | | | | Threshold | | | Target | | | Maximum | | | Performance Measure | | Weighting | | | Performance | | | Payout | | | Performance | | | Payout | | | Performance | | | Payout | | Organic Revenue Growth | | | 40 | % | | | 95 | % | | | 25 | % | | | 100 | % | | | 100 | % | | | 111 | % | | | 200 | % | Adjusted EBITDA Margin | | | 30 | % | | | 85 | % | | | 25 | % | | | 100 | % | | | 100 | % | | | 115 | % | | | 200 | % | Strategic Measures* | | | 30 | % | | | 85 | % | | | 25 | % | | | 100 | % | | | 100 | % | | | 115 | % | | | 200 | % |
* At the beginning of 2018, the Compensation Committee approved specific strategic measures focused on further development of each practice area and further improvements in the effectiveness and efficiencies of Huron’s infrastructure. A target award would reflect full achievement of these objectives, as assessed by the Committee. The Committee applies its judgment in determining overall performance on the measure. | | | | 2018 Long-Term Incentive Program | | Changes Made: | | Reasons for Change: | • Utilizing a full three-year performance measurement cycle. • Adding a revenue growth goal to be re-earned based on three-year performance. A multiplecomplement the adjusted EPS goal. | | • Reflects multi-year performance rather than the sum of 2.0 is usedannual goals. • Focuses on the high end. The Compensation Committee determined that if performance over a three-year period averaged 120% or more, that represents exceptional sustained performance and justifies a significant award.importance of top line growth to drive shareholder value. |
The 2018 long-term incentive program design is summarized below: | | | | | | | | | | | | Vehicles | | Weighting | | | Performance Measure | | | | Performance/Vesting Timeline | Performance Units | | | 70 | % | | 40% Adjusted Diluted EPS
30% Organic Revenue Growth | | Three-Year (cliff) | Restricted Shares | | | 30 | % | | Continued employment | | Three-Year (ratable) |
| | SECTION 4 - ADDITIONAL DISCLOSURES RELATED TO COMPENSATION PROGRAM |
Stock Price Graph
The chart below shows the change in stock price from December 31, 2013 to December 31, 2015 (last two years).
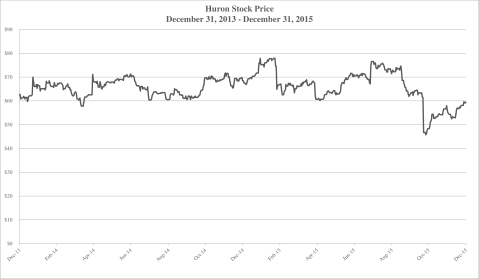
Executive Pay Peer Group BasedThe peer group developed in 2016 to inform 2017 pay decisions was modified based on the annual review of peer group criteria, theExecutive Pay Peer Group criteria. The Compensation Committee elected to expand the peer group from eleven11 companies to sixteen companies during 2015.16 companies. The Committee believes that this larger peer group will provide better insights into the compensation practices of business peers and will be less volatile due to the compensation changes made by one company. Companies were identified based on the following process:
| | 1. | All companies were identified that met the following criteria: |
US headquartered and publicly traded. Revenue betweenone-half to two times Huron’s trailing 12 monthsmonths’ revenue as of Huron’s 20142016 fiscalyear-end. Global Industry Classification Standard (GICS) codes: Research and Consulting Services, Human Resource & Employment Services, Application Software, Health Care Services or Technology, or Data Processing and Outsourced Services. | | 2. | Companies were then screened and selected that best met the following set of factors: |
Business and/or labor market competitor to Huron. Similar revenue per employee. Predominantly US revenue. Principal business was to provide value-added consulting or advisory services to companies and organizations. As a result of the review and application of these criteria, the Compensation Committee addedapproved the following companies to the peer group: companies: Allscripts Healthcare Solutions, Inc., Dun & Bradstreet Corporation Heidrick & Struggles International, Inc. and Korn/Ferry International. The Committee also determined it would remove Accretive Health. Those who remained inInternational Resources Connection, Inc. Additional changes were made to the peer group fromin 2017 in advance of 2018 pay determination. Gartner acquired CEB, thus the prior year were: The Advisory Board, Inc., CBIZ Inc., EPIQ Systems, Inc., FTI Consulting, Inc., ICF International Inc., IHS, Inc.,Committee removed CEB as a peer, and the Committee elected to remove Gartner and Maximus Inc., MedAssets Inc., Navigant Consulting Inc.due to their larger size relative to Huron. Lastly, Acxiom Corporation and Resources Connection, Inc. HMS Holdings Corporation were added to maintain a peer group of robust size.Employment Agreements with Mr. Roth, Mr. Hussey, Mr. Kelly and Ms. Ratekin Huron has entered into agreements with each of the named executive officers that provide for benefits upon termination of employment under certain circumstances, including in connection with a change of control of the Company. Huron provides these benefits as a means of remaining competitive, retaining executive officers, focusing executive officers on shareholder interests when considering strategic alternatives, and providing income protection in the event of involuntary loss of employment. In general, these arrangements provide for severance benefits upon Huron’s termination of the executive’s employment without cause or resignation by the executive for good reason (constructive termination). In the event of a change of control of Huron, and if the executive’s employment is terminated without cause or he or she resigns for good reason, the executive will receive enhanced severance benefits. Huron provides these enhanced severance benefits only with a so-called “double trigger” because the Company believes that the executive officers would be materially harmed in a change of control only if it results in reduced responsibilities or compensation or loss of employment for the executive. Consistent with generally accepted best practices, Huron employment agreements do not containprovide for any gross-up provisions that would obligate the Company to pay excise tax payments to the CEO and other named executive officers in the event of a change of control.gross-ups. More information on our use of employment agreements, including the estimated payments and benefits payable to the named executive officers, is provided under the “Potential Payments Upon Termination or Change of Control” section of this Proxy Statement. Role of Compensation Committee The Compensation Committee is primarily responsible for administering our executive compensation program in a manner consistent with our compensation philosophy and objectives. The principal functions of the Compensation Committee are to: set salaries and annual and long-term incentive levels for the CEO and other named executive officers; evaluate annually the performance of the CEO (in coordination with the full board) and review the CEO evaluations of the other named executive officers; review and approve the design and competitiveness of our compensation plans, executive benefits and perquisites; review and approve the total cash and stock bonus pools for the organization, and approve the individual incentive payout awards for the named executive officers; | �� | review director compensation and make recommendations to the board; |
review and approve goals used for the annual and long-term incentive plans; retain or terminate, in its sole discretion, any independent compensation consultant used to assist the Compensation Committee; review and evaluate compensation arrangements to assess whether they could encourage undue risk taking; and create a Compensation Committee report on executive compensation for inclusion in the proxy statement.Proxy Statement. The Compensation Committee acts independently, and works closely with our board of directors and the executive management team, in making many of its decisions. To support its decision making, the Compensation Committee has retained the services of an independent compensation consultant, Semler Brossy Consulting Group, LLC (“Semler Brossy”).consultant. The Compensation Committee has the sole authority to amend or terminate the services of its independent consultant. In 2015,2017, the Compensation Committee was comprised entirely of independent directors, none of whom has at any time been an officer or employee of the Company. Role of Management Our CEO works together with the Corporate Vice President, Chief Human Resources Officer and the Compensation Committee of our board to establish, review and evaluate compensation packages and policies for our executive officers. Our CEO reviews the performance of each named executive officer and makes recommendations to the Compensation Committee based on his review. Our CEO, COO/COO, CFO and General Counsel provide input into our strategic goals for future performance periods. The Compensation Committee carefully reviews all information before finalizing incentive goals, however, as we believe such a process is consistent with good governance. Prior to determining the size of the bonus pool for all employees other than NEOs, management reviews Company and practicepractice-level performance with the Chairman of the board so that the bonus pool and Company profitability strike the right balance between shareholder returns and retention of employees. Our CEO does not participate in any discussions related to his own compensation. Role of Compensation Advisor The Compensation Committee continued to retain Semler Brossy as itsretains an independent advisor for the 2015 fiscal year to assist in the ongoing assessment of our executive compensation strategy and program. Semler BrossyThe Committee’s independent advisor reports directly to the Compensation Committee and serves at its sole discretion. Semler Brossydiscretion and does not perform any services for the Company other than those in connection with its work for the Compensation Committee. Semler Brossy served as the Compensation Committee’s independent advisor through the first half of 2017, at which time the Compensation Committee retained Pay Governance to serve as its independent advisor. The Compensation Committee annually analyzes whether the work of Semler Brossy as a compensation consultantadvisor’s work has raised any conflict of interest. The Compensation Committee has determined, based on its analysis of NASDAQ requirements, that the work of Semler Brossy and Pay Governance and the individual compensation advisors employed by Semler Brossy and Pay Governance as compensation consultants to the Company has not created any conflict of interest. 20152017 Say on Pay Vote
In 2015,2017, we received a shareholder advisory vote (commonly referred to as “Say on Pay”) in excess of 99% in support of the named executive officer compensation. We believe this positive vote reflects the strong pay for performance relationship in our executive compensation program and supports the changes that have been made in recent years to improve the program. We continue to listen carefully to our shareholders and incorporate their feedback into our deliberations about executive compensation. ShareholdersAs in 2011, shareholders at the 20112017 Annual Meeting expressed a preference that advisory votes on executive compensation occur every year. Consistent with this preference, the Company has held and will continue to hold its advisory vote on the compensation of the Company’s named executive officers annually until the 20172023 Annual Meeting at which time shareholders will again be asked to vote on the frequency of advisory votes on named executive officer compensation. Health and Welfare Benefits The named executive officers are eligible for the same health and welfare benefits generally available to Huron employees. Deferred Compensation The Company also offers a nonqualified deferred compensation plan (the “DCP”) to all managing directors, corporate vice presidents, named executive officers and independentnon-employee directors. The DCP allows participantsmanaging directors, corporate vice presidents and executives to elect to defer up to 75% of their base salary and 100% of their annual cash incentive into a deferred compensation account and to choose from a number of investment alternatives.Non-employee directors may elect to defer up to 100% of their board fees into the DCP. Perquisites Huron did not provide material perquisites that are not provided widely within Huron to any named executive officer in 2015.2017. The Company provides enhanced disability and life insurance benefits to all of its managing directors, corporate vice presidents and executive officers. The CEO and Executive Vice Presidents are also offered reimbursement of the cost of an annual executive physical examination. Clawback Provisions In 2014, we adopted an incentive compensation recoupment policy (commonly referred to as a “clawback policy”) that provides for the potential recoupment of bonuses or awards paid to executive officers and such other individuals designated by our independent directors under our shortshort-term and long-term incentive compensation plans, where the payout or actual award received was determined based in part on the financial performance of the Company or one of its practice areas.Company. In the event of a material restatement of our quarterly or annual financial results, our independent directors will review all incentive compensation awarded to those individuals covered by the policy based upon the achievement of financial results that were the subject of the restatement. The independent directors have the authority to recoup all or a portion of the incentive compensation to the extent that the amount of such compensation would have been lower than the amount actually awarded, granted, paid, earned, deferred or vested based on the achievement of financial results that were subsequently reduced due to such restatement. Stock Ownership Guidelines and Holding Requirements Hedging and Pledging Policies In 2010, the Compensation Committee adopted stock ownership guidelines for Huron’s named executive officers andnon-employee directors. The guidelines, set forth below, are consistent with peer practices and designed to promote alignment with the interests of stockholders and the Company’s commitment to sound corporate governance. | | | Position | | Stock Ownership Guideline | CEO | | the lesser of 3x salary or 120,000 shares | COO/COO and CFO
| | the lesser of 2x salary or 50,000 shares | Other Executive Officers | | the lesser of 1x salary or 20,000 shares | Non-employee Directors (first directors
(elected prior to 2014 annual meeting) | | the lesser of 3x annual retainer or 9,000 shares | Non-employee directors
(elected on or after 2014 annual meeting) | | the lesser of 3x annual retainer or the # of shares equivalent to 3x annual retainer/share price on day prior to annual meeting when first elected |
Until the relevant stock ownership target is achieved, executive officers andnon-employee directors are required to retain a number of shares equal to at least 60% of the net after tax proceeds from the exercise of stock options or vesting of restricted stock and performance shares. Only shares owned outright count towards ownership requirements. Unexercised stock options and unvested performance shares or unvested restricted stock do not count. Mr. Roth and Ms. Ratekin and all All of our NEOs andnon-employee directors serving asare in compliance with the terms of the 2015 annual meeting have met the stockour share ownership guidelines. Mr. Hussey is expected to retain a number of shares equal to at least 60% of the net after tax value from the exercise of stock options or vesting of restricted stock
Hedging and performance shares until he satisfies the ownership requirements.Pledging The Company has an insider trading policy that prohibits directors, officers, employees and contractors from entering into transactions in publicly traded puts, calls or other derivative securities with respect to Huron’s stock and requires thatprohibits any other transaction that “hedges” the ownership in Huron’s stock be pre-cleared by the General Counsel. In addition, the board has adopted a policy that requires board approval of any hedging activities by executive officers, and the board has indicated it would not approve any such hedging activities except in unusual circumstances. The Company also has a pledging policy that in general prohibits directors, officers, employees, and contractors fromor holding Company securities in a margin account or pledging Company securities as collateral for a loan. Limited exceptions may be made by the General Counsel if the person wishes to pledge Company securities as collateral for a loan (not including margin debt) and clearly demonstrates the financial capacity to repay the loan without resort to the pledged securities.
Tax Considerations Section 162(m). Section 162(m) of the Code generally limits the deductibilitydisallows a tax deduction to public companies for federal income tax purposes of compensation paid in excess of $1 million for any fiscal year to certain specified covered employees. Under the CEOrules in effect before 2018, compensation that qualified as “performance-based compensation” under Section 162(m) was deductible without regard to this $1 million limit. The recent Tax Cuts and Jobs Act generally eliminated the performance-based compensation exception under Section 162(m), effective January 1, 2018, subject to a special rule that “grandfathers” certain awards and arrangements that were in effect on or anybefore November 2, 2017. To date, the IRS has not issued guidance interpreting the Tax Cuts and Jobs Act. While the Committee intended that certain incentive awards granted to our NEOs on or prior to November 2, 2017 be deductible as “performance-based compensation,” it cannot assure that result. The Committee has taken the potential impact of the next three most highly paid executive officers of a publicly held corporation (other than the CFO). Huron may deduct compensation exceeding $1 millionTax Cuts and Jobs Act into consideration when approving payout amounts for federal income tax purposes if the compensation is paid pursuant to a performance-based, nondiscretionary plan that is approved by stockholders. Both the Annual Incentive Plan and the equity plans are intended to comply with all the provisions of Section 162(m), although the rules are complex and any particular result cannot be guaranteed and, furthermore, the Compensation Committee reserves the right to pay compensation that may not be deductible under Section 162(m).performance periods ending on December 31, 2017. Section 280G. Section 280G of the Code disallows a company’s tax deduction for certain payments in connection with a change of control defined as “excess parachute payments,” and Section 4999 of the Code imposes a 20% excise tax on certain persons who receive excess parachute payments. The Compensation Committee amended Senior Management Agreements in 2010 to ensure that any covered payments would be reduced to the extent necessary so that no portion of such payments is subject to the excise tax. Compensation Committee ReportCOMPENSATION COMMITTEE REPORT
The Compensation Committee has reviewed and discussed with management the information contained under the caption “Compensation Discussion and Analysis” and, based on this review and discussion, has recommended to the board of directors that it be included in this Proxy Statement and incorporated by reference into our 20152017 Annual Report on Form10-K. Debra Zumwalt, Chair H. Eugene Lockhart John S. Moody | | REQUIRED COMPENSATION DISCLOSURES |
2015 Summary Compensation Table2017 SUMMARY COMPENSATION TABLE
| | | | | | | | | | | | | | | | | | | | | | | Name and Principal Position | | Year | | Salary
($) | | Bonus
($) (1) | | Non Equity
Incentive Plan
Compensation
($) | | Stock
Awards
($) (2) | | | Option
Awards
($) (3) | | Change in
Pension
Value and
Nonqualified
Deferred
Compensation
Earnings
($) (4) | | All Other
Compensation
($) (5) | | Total
Compensation
($) | | James H. Roth | | 2015 | | 900,000 | | — | | 594,000 | | | 2,662,934 | | | — | | — | | 31,134 | | | 4,188,068 | | President and Principal
Executive Officer | | 2014 | | 900,000 | | — | | 960,300 | | | 2,237,621 | | | — | | — | | 30,634 | | | 4,128,555 | | | | 2013 | | 800,000 | | 436,000 | | 932,800 | | | 979,985 | | | 419,983 | | — | | 30,060 | | | 3,598,828 | | C. Mark Hussey (6) | | 2015 | | 550,000 | | — | | 297,000 | | | 904,174 | | | — | | — | | 30,905 | | | 1,782,079 | | Executive Vice President,
Principal Operating Officer,
Principal Financial Officer
and Treasurer | | 2014 | | 550,000 | | — | | 480,150 | | | 759,698 | | | — | | 23,173 | | 30,468 | | | 1,843,488 | | | | 2013 | | 450,000 | | 152,000 | | 381,600 | | | 315,009 | | | 134,983 | | — | | 27,156 | | | 1,460,748 | | | | | | | | | | | | | | | | | | | | | | | | | | | | | | | | | | | | | | | | | | | | | | | | Diane E. Ratekin | | 2015 | | 400,000 | | — | | 120,000 | | | 473,415 | | | — | | 0 | | 30,635 | | | 1,024,050 | | Executive Vice President,
General Counsel and
Corporate Secretary | | 2014 | | 400,000 | | — | | 194,000 | | | 397,764 | | | — | | 7,988 | | 28,761 | | | 1,028,513 | | | | 2013 | | 375,000 | | 93,000 | | 198,750 | | | 196,891 | | | 84,367 | | 18,201 | | 27,570 | | | 993,779 | | | | | | | | | | | | | | | | | | | | | | | | |
| | | | | | | | | | | | | | | | | | | | Name and Principal Position | | Year | | Salary
($) | | Non Equity
Incentive Plan
Compensation
($) | | Stock
Awards
($)(1) | | | Change in
Pension
Value and
Nonqualified
Deferred
Compensation
Earnings
($)(2) | | All Other
Compensation
($)(3) | | Total
Compensation
($) | | James H. Roth | | 2017 | | 900,000 | | 595,980 | | | 2,699,973 | | | 308,563 | | 31,434 | | | 4,535,950 | | President and Principal Executive Officer | | 2016 | | 900,000 | | 207,900 | | | 1,939,930 | | | 83,903 | | 27,109 | | | 3,158,842 | | | | 2015 | | 900,000 | | 594,000 | | | 2,662,934 | | | 0 | | 31,134 | | | 4,188,068 | | C. Mark Hussey | | 2017 | | 743,750 | | 451,500 | | | 2,312,472 | | | 150,059 | | 30,985 | | | 3,688,766 | | Executive Vice President and Principal Operating Officer | | 2016 | | 600,000 | | 126,000 | | | 1,005,895 | | | 60,624 | | 26,435 | | | 1,818,954 | | | | 2015 | | 550,000 | | 297,000 | | | 904,174 | | | 0 | | 30,905 | | | 1,782,079 | | John D. Kelly (4) | | 2017 | | 323,333 | | 136,955 | | | 344,197 | | | N/A | | 23,113 | | | 827,598 | | Executive Vice President and Principal Financial Officer | | | | | | | | | | | | | | | | | | | | | | | | | | | | | | | | | | | | | | Diane E. Ratekin | | 2017 | | 400,000 | | 120,400 | | | 460,003 | | | 18,353 | | 31,719 | | | 1,030,475 | | Executive Vice President, General Counsel and Corporate Secretary | | 2016 | | 400,000 | | 42,000 | | | 438,686 | | | 6,411 | | 35,221 | | | 922,318 | | | | 2015 | | 400,000 | | 120,000 | | | 473,415 | | | 0 | | 30,635 | | | 1,024,050 | | | | | | | | | | | | | | | | | | | | |
| (1) | No bonuses were granted in 2014 or 2015. The amounts in this column for 2013 represent discretionary awards determined by the board in recognition of performance that was not rewarded under the 162(m) performance awards due to the low 125% cap for each element.
|
(2) | This column represents the aggregate grant date fair value of restricted stock and/or performance share unit awards. The value of the performance share units in the table is consistent with the estimate of aggregate compensation cost to be recognized over the service period determined as of the grant date under FASB ASC Topic 718. |
In 2015 the executives each received grants of restricted stock and performance share units. The amounts above reflect the grant date fair value of the restricted stock and performance share unit awards. The values for the 2015 performance share unit awards are based on the accounting assumptions used at the time of grant. The values assumed that 40% of the award, which is tied to annual performance, would have been earned at 100%, and 60% of the award, which is tied to three-year performance, would have been earned at 175%. The 175% estimated payout value was based on the average performance compared to target for the three-year period 2014 to 2016. Actual performance for 2014 was 151%, and based on the assumption that performance for each of 2015 and 2016 was estimated to be at 100%, the resulting average of the three performance years would be 117%. Based on the payout table established for the deferred portion of the award, the average performance of 117% would result in a 175% payout. Based on actual 2015 performance, the most recent estimate for the payout for the three-year portion of the awards under this plan would be 90% instead of 175%.
The below chart is the detail of the Stock Awards amounts in the Summary Compensation Table above, representing the grant date fair value of both the performance share units and the restricted stock awards.
| | | | | | Grant Date Fair Value | | | | 2015 Performance
Share Units ($) | | 2015 Restricted Stock
Awards ($) | James H. Roth | | 2,055,419 | | 607,515 | C. Mark Hussey | | 697,892 | | 206,282 | Diane E. Ratekin | | 365,442 | | 107,973 |
The actual amount earned on the performance share unit awards granted in 2015 was 0%. The below chart represents the adjusted values using the value of the earned performance shares:
| | | | | | | | Impact on Total Compensation Using Earned Value of Performance Share Units | | | | 2015 Earned Performance Share Units ($) | | 2015 Restricted Stock Awards ($) | | Total Compensation Based on
Value of Earned Performance Share Units ($) | James H. Roth | | 0 | | 607,515 | | 2,132,649 | C. Mark Hussey | | 0 | | 206,282 | | 1,084,187 | Diane E. Ratekin | | 0 | | 107,973 | | 658,608 |
In 2014 the executives each received grants of restricted stock and performance share units. The amount represented for each of the performance share units is the grant date fair value of the award. The values assumed that 40% of the award, which is tied to annual performance, would have been earned at 100%, and 60% of the award, which is tied to three-year performance, would have been earned at 125%. The 125% estimated payout value was based on the assumption that each of the three years for 2014, 2015 and 2016 was earned at 100%, resulting in a 125% multiple. The annual portion of this award was earned at 125% of target. The remaining 60% of the award will be earned at the end of the 2016 performance year based on the three-year performance period from 2014 to 2016. Based on actual 2014 and 2015 performance, the most recent estimate for the payout of the three-year portion of the awards under this plan would be 90%.
In 2013 the executives received only performance share units. No restricted stock was granted. The amount shown represents the grant date fair value of the awards at target performance. The actual amount earned was 125% of target.
In prior years, the amounts represented in this portion of the table represented the earned amounts for all performance shares.
For further details on the 2015 performance share unit plan, please refer to “Performance Share Awards” in “Section 3 - Compensation Program Details” of the “Compensation Discussion and Analysis.”
(3) | This column represents the aggregate grant date fair value of options granted in each of the respective years. Values represented are calculated using theBlack-Scholes valuation method. No options were granted in 2014 or 2015.
|
(4)(2) | The amounts in this column represent investment gains in the deferred compensation plan. Huron does not offer a pension plan. The amount shown above represents that portion of the account earnings that exceeded the SEC benchmark “market” rate equal to 120% of thelong-term applicable federal rate (based on the average rate for 2017, 2016 and 2015 2014of 2.72%, 2.70% and 2013 of 3.05%, 3.79% and 3.47%, respectively). For 2015,2017, the actual earnings for Mr. Roth, Mr. Hussey and Ms. Ratekin were -$13,719, $7,620$385,248, $177,842 and -$632,$22,149, respectively. These amounts were less than the 3.05% market rate. Mr. Roth began participation in the deferred compensation plan in 2015. Mr. Hussey began participation in the plan in 2014. Ms. Ratekin’s earnings relate to amounts contributed to the plan prior to her becoming a named executive officer. Please see the section entitled “2015“2017 Nonqualified Deferred Compensation” below for more detail. |
(5)(3) | All Other Compensation for 20152017 is detailed in the table below. |
(6)(4) | On January 3, 2017, Mr. HusseyKelly was appointed aspromoted to the position of Executive Vice President and Chief Operating Officer in addition to his CFO role on February 25, 2014.Financial Officer. Formerly, Mr. Kelly had been Corporate Vice President and Chief Accounting Officer. |
20152017 All Other Compensation
| | | | | | | | | | | Name | | Executive Long-
Term Disability
($)(1) | | Executive $1MM
Term Life
Insurance
($)(2) | | Company Provided
401(k) Match
($)(3) | | Other Benefits
and
Perquisites
($)(4) | | Total All Other
Compensation
($)(5) | James H. Roth | | 6,776 | | 4,433 | | 15,900 | | 4,025 | | 31,134 | C. Mark Hussey | | 7,101 | | 3,204 | | 15,900 | | 4,700 | | 30,905 | Diane E. Ratekin | | 7,952 | | 2,173 | | 15,900 | | 4,610 | | 30,635 |
| | | | | | | | | | | | | | | | | | | | | | Name | | Executive Long-
Term Disability
($)(1) | | | Executive $1MM Term Life Insurance
($)(2) | | | Company Provided
401(k) Match
($)(3) | | | Other Benefits
and
Perquisites
($)(4) | | | Total All
Other
Compensation
($) | | James H. Roth | | | 6,776 | | | | 4,433 | | | | 16,200 | | | | 4,025 | | | | 31,434 | | C. Mark Hussey | | | 7,101 | | | | 3,204 | | | | 16,200 | | | | 4,480 | | | | 30,985 | | John D. Kelly | | | 1,830 | | | | 1,058 | | | | 16,200 | | | | 4,025 | | | | 23,113 | | Diane E. Ratekin | | | 7,952 | | | | 7,487 | | | | 16,200 | | | | 80 | | | | 31,719 | |
| (1) | Executive Long-Term Disability is provided to all executives and managing directors. |
| (2) | Executive Term Life Insurance is provided to all executives and managing directors. |
| (3) | Huron provides a Company 401(k) match to all participating employees. |
| (4) | Other Benefits and Perquisites includes the cost of an executive physical, which Huron pays for executives and certain managing directors, and a wellness benefit available to all employees that reimburses up to $300$320 annually for purchases that assist in maintaining work-life balance. The wellness benefit was discontinued as of June 2017. |
(5) | The table does not include any amounts for use of sports tickets by the named executive officers because no incremental costs were incurred by the Company. The Company purchases season tickets to sporting events for business outings with customers and vendors. If the tickets are not being used for business purposes, the named executive officers and other employees may have opportunities to use these tickets. Huron provides no other executive perquisites.
|
CEO Pay Ratio As a result of the Dodd-Frank Act, beginning with our 2018 Proxy Statement, the SEC will require disclosure of the CEO to median employee pay ratio. Mr. Roth received 2017 annual total compensation of $4,535,950 as reflected in the Summary Compensation Table included in this Proxy Statement. Our median employee’s annual total compensation for 2017 was $118,710. As a result, we estimate that Mr. Roth’s 2017 annual total compensation was approximately 38 times that of our median employee. 2015 Grants of Plan-Based Awards2017 GRANTSOF PLAN-BASED AWARDS
The following table summarizes the grants of equity awards and annual cash incentive awards for 20152017 to each named executive officer. | | | | | | | | | | | | | | | | | | | | | | | | | | | | | | | Estimated Future Payouts
Under Non-Equity Incentive
Plan Awards (1) | | Estimated Future Payouts
Under Equity Incentive
Plan Awards (2)(3) | | | | | Name | | Grant
Date | | | Date of
Compensation
Committee
Action | | Threshold
($) | | Target
($) | | Maximum
($) | | Threshold
(#) | | Target
(#) | | Maximum
(#) | | All Other
Stock
Awards:
Number of
Shares of
Stock
(#)(3) | | Full Grant
Date Fair
Value of
Each
Award
($)(4) | | | | | | | | | | | | | | | | | | | | | | | | James H. Roth | | | 3/1/2015 | (5) | | 2/11/2015 | | — | | — | | — | | 0 | | 8,507 | | 10,634 | | — | | 566,992 | | | | 3/1/2015 | (6) | | 2/11/2015 | | — | | — | | — | | 0 | | 12,761 | | 31,903 | | — | | 850,521 | | | | 3/1/2015 | | | 2/11/2015 | | — | | — | | — | | — | | — | | — | | 9,115 | | 607,515 | | | | | | | | | 0 | | 990,000 | | 1,237,500 | | — | | — | | — | | — | | — | C. Mark Hussey | | | 3/1/2015 | (5) | | 2/11/2015 | | — | | — | | — | | 0 | | 2,888 | | 3,610 | | — | | 192,485 | | | | 3/1/2015 | (6) | | 2/11/2015 | | — | | — | | — | | 0 | | 4,333 | | 10,833 | | — | | 288,794 | | | | 3/1/2015 | | | 2/11/2015 | | — | | — | | — | | — | | — | | — | | 3,095 | | 206,282 | | | | | | | | | 0 | | 495,000 | | 618,750 | | — | | — | | — | | — | | — | Diane E. Ratekin | | | 3/1/2015 | (5) | | 2/11/2015 | | — | | — | | — | | 0 | | 1,512 | | 1,890 | | — | | 100,775 | | | | 3/1/2015 | (6) | | 2/11/2015 | | — | | — | | — | | 0 | | 2,269 | | 5,673 | | — | | 151,229 | | | | 3/1/2015 | | | 2/11/2015 | | — | | — | | — | | — | | — | | — | | 1,620 | | 107,973 | | | | | | | | | 0 | | 200,000 | | 250,000 | | — | | — | | — | | — | | — |
| | | | | | | | | | | | | | | | | | | | | | | | | | | | | | | | | | | | | | | | | | | | | | | | | | | | | | Estimated Future Payouts
Under Non-Equity Incentive
Plan Awards (1) | | | | | | Estimated Future Payouts
Under Equity Incentive Plan Awards (2) | | | | | | | | | Name | | Grant Date | | | Date of
Compensation
Committee
Action | | | Threshold
($) | | | Target ($) | | | Maximum
($) | | | | | | Threshold
(#) | | | Target (#) | | | Maximum
(#) | | | All Other
Stock
Awards:
Number of
Shares of
Stock
(#)(3) | | | Full Grant
Date Fair
Value of
Each
Award
($)(4) | | James H. Roth | | | 3/15/2017 | (5) | | | 2/20/2017 | | | | — | | | | — | | | | — | | | | | | | | 13,863 | | | | 27,726 | | | | 55,452 | | | | — | | | | 1,133,993 | | | | | 3/15/2017 | (6) | | | 2/20/2017 | | | | — | | | | — | | | | — | | | | | | | | 9,242 | | | | 18,484 | | | | 36,968 | | | | — | | | | 755,996 | | | | | 3/15/2017 | | | | 2/20/2017 | | | | — | | | | — | | | | — | | | | | | | | — | | | | — | | | | — | | | | 19,804 | | | | 809,984 | | | | | | | | | | | | | 247,500 | | | | 990,000 | | | | 1,485,000 | | | | | | | | — | | | | — | | | | — | | | | — | | | | — | | C. Mark Hussey | | | 3/15/2017 | (5) | | | 2/20/2017 | | | | — | | | | — | | | | — | | | | | | | | 6,739 | | | | 13,478 | | | | 26,956 | | | | — | | | | 551,250 | | | | | 3/15/2017 | (6) | | | 2/20/2017 | | | | — | | | | — | | | | — | | | | | | | | 4,493 | | | | 8,985 | | | | 17,970 | | | | — | | | | 367,487 | | | | | 3/15/2017 | | | | 2/20/2017 | | | | — | | | | — | | | | — | | | | | | | | — | | | | — | | | | — | | | | 9,627 | | | | 393,744 | | | | | 8/21/2017 | | | | 8/17/2017 | | | | — | | | | — | | | | — | | | | | | | | — | | | | — | | | | — | | | | 32,051 | | | | 999,991 | | | | | | | | | | | | | 187,500 | | | | 750,000 | | | | 1,125,000 | | | | | | | | — | | | | — | | | | — | | | | — | | | | — | | John D. Kelly | | | 3/1/2017 | | | | 2/10/2017 | | | | — | | | | — | | | | — | | | | | | | | — | | | | — | | | | — | | | | 442 | | | | 19,205 | | | | | 3/15/2017 | (5) | | | 2/20/2017 | | | | — | | | | — | | | | — | | | | | | | | 1,669 | | | | 3,337 | | | | 6,674 | | | | — | | | | 136,483 | | | | | 3/15/2017 | (6) | | | 2/20/2017 | | | | — | | | | — | | | | — | | | | | | | | 1,113 | | | | 2,225 | | | | 4,450 | | | | — | | | | 91,003 | | | | | 3/15/2017 | | | | 2/20/2017 | | | | — | | | | — | | | | — | | | | | | | | — | | | | — | | | | — | | | | 2,384 | | | | 97,506 | | | | | | | | | | | | | 56,875 | | | | 227,500 | | | | 341,250 | | | | | | | | — | | | | — | | | | — | | | | — | | | | — | | Diane E. Ratekin | | | 3/15/2017 | (5) | | | 2/20/2017 | | | | — | | | | — | | | | — | | | | | | | | 2,362 | | | | 4,724 | | | | 9,448 | | | | — | | | | 193,212 | | | | | 3/15/2017 | (6) | | | 2/20/2017 | | | | — | | | | — | | | | — | | | | | | | | 1,575 | | | | 3,149 | | | | 6,298 | | | | — | | | | 128,794 | | | | | 3/15/2017 | | | | 2/20/2017 | | | | — | | | | — | | | | — | | | | | | | | — | | | | — | | | | — | | | | 3,374 | | | | 137,997 | | | | | | | | | | | | | | 50,000 | | | | 200,000 | | | | 300,000 | | | | | | | | — | | | | — | | | | — | | | | — | | | | — | |
| (1) | For the cash award, the target, threshold and maximum represent the range of cash award that could be earned. There is no payout if a threshold level of performance is not achieved. The minimum amount that could be paid is 25% of target and maximum represents 125%150% of target. Based on the achievement of specific financial goals, the Compensation Committee determined that 60% of the target award was earned. |
| (2) | The 20152017 grant of PSUsPerformance Share Units (PSUs) consists of two components: aone-year component based on 20152017 performance and a three-year component based on 2014-20162017-2019 performance. Annual performance with respect toThe PSUs that comprise the 2015 performance period is assessed after the end of the 2015 performance period and the target number of PSUs is adjustedone-year component are earned based on 2015 performance. The adjustment rangesperformance for the 2017 performance period. These PSUs are earned from 25%50% of target for threshold performance to 125%200% of target for maximum performance; however, if threshold performance is not achieved, the amount of the full award will be forfeited. For this reason, threshold is shown as zero. Forty percentThe PSUs that comprise theone-year component that are earned are then subject to vesting based on continued employment withone-third of the adjusted PSUs (which comprise the one-year component) are earned and vestaward vesting each year following the 20152017 performance period.period, commencing March 15, 2018. The remaining 60% of the adjusted PSUs (whichthat comprise the three-year component)component are subject to a three-year performance period (2014-2016) and are subject to further adjustmentearned based on 2017-2019 performance. These PSUs are earned from 50% of target for threshold performance to 200% of target for such period.maximum performance; however, if threshold performance is not achieved, the award will be forfeited. The multiplePSUs that could be applied oncomprise the three-year portion of the award ranges from .75 to 2.0. Once the 2014-2016 performance period is complete, 50% of the final award vests immediately and 50% of the final award is subject to a one-year service period through the end of 2017.component that are earned vest on March 15, 2020. |
The target award column represents the base number of shares that could be earned; the threshold column represents the minimum number of shares (0) and the maximum column represents the maximum number of shares (either 125% of target for the one-year component or 250% for the three-year component) that each named executive officer could earn. If all elements of the awards were earned at the maximum level, the maximum amount earned would be 200% of target since 40% of the award cannot be paid out at an amount higher than 125% and the remaining 60% of the award cannot be paid out at an amount higher than 250%.
The following table shows the actual number of PSUs earned with respect to 2015 performance (which represents the earned amount for both the one-year and three-year components).
| | | | | Name | | Performance Share
Units Earned | | Performance Share
Units Vested | James H. Roth | | 0 | | 0 | C. Mark Hussey | | 0 | | 0 | Diane E. Ratekin | | 0 | | 0 |
| (3) | PSUs and restrictedRestricted stock granted under the Company’s 2012 Omnibus Incentive Plan.
|
| (4) | The full grant date fair value of the March 1, 2017 RSA is based on the closing price of Huron stock of $43.45 on February 28, 2017. The full grant date fair values of the March 1, 201515, 2017 RSAs and PSUs are based on the closing price of Huron stock of $66.65$40.90 on February 27, 2015, the last trading day prior to the grant of the awards.March 14, 2017. The total number of shares earned by recipients of these awards iswas contingent uponon meeting Adjusted EPS goals as described in Note (2) above. |
| (5) | The March 1, 201515, 2017 grant of PSUs consists of two components, aone-year component for the 20152017 performance period and a three-year component for the 2014-20162017-2019 performance period. This row reports information for theone-year component of the award for 2015.2017. |
| (6) | The March 1, 201515, 2017 grant of PSUs consists of two components, aone-year component for the 20152017 performance period and a three-year component for the 2014-20162017-2019 performance period. This row reports information for the three-year component of the award for the 2014-20162017-2019 performance period. |
2015 Outstanding Equity Awards at Fiscal Year-End2017 OUTSTANDING EQUITY AWARDSAT FISCAL YEAR-END
The following table sets forth certain information concerning outstanding stock and option awards as of December 31, 20152017 for each named executive officer. Market value is based on the closing price of Huron stock of $59.40$40.45 on December 31, 2015.29, 2017, the last trading day of the fiscal year. | | | | | | | | | | | | | | | | | | | | | | | | | | | Option Awards | | Stock Awards | Name | | Grant
Date | | | Number of
Securities
Underlying
Unexercised
Options (#)(1)
Exercisable | | Number of
Securities
Underlying
Unexercised
Options (#)
Unexercisable | | Option
Exercise
Price ($) | | Option
Expiration
Date | | Number of
Shares or
Units of
Stock that
Have Not
Vested (#) | | Market Value
of Shares or
Units of
Stock that
Have Not
Vested as of
12/31/2015 ($) | | Equity
Incentive
Plan Awards:
Number of
Unearned
Share, Units
or Other
Rights that
Have Not Yet
Vested (#) | | Equity
Incentive Plan
Awards:
Market or
Payout Value
of Unearned
Share, Units
or Other
Rights that
Have Not Yet
Vested ($) | James H. Roth | | | 5/03/2010 | | | 100,000 | | — | | 23.43 | | 5/03/2020 | | — | | — | | — | | — | | | | 3/11/2011 | | | 27,031 | | — | | 26.19 | | 3/11/2021 | | — | | — | | — | | — | | | | 3/01/2012 | | | 14,745 | | 4,916 | | 38.18 | | 3/01/2022 | | — | | — | | — | | — | | | | 3/01/2013 | | | 12,027 | | 12,027 | | 39.19 | | 3/01/2023 | | — | | — | | — | | — | | | | 3/01/2014 | | | — | | — | | — | | — | | — | | — | | 14,460 (3) | | 858,924 | | | | 3/01/2014 | | | — | | — | | — | | — | | 6,886 (2) | | 409,028 | | — | | — | | | | 3/01/2015 | | | — | | — | | — | | — | | 9,115 (2) | | 541,431 | | — | | — | C. Mark Hussey | | | 8/01/2011 | | | 1,772 | | — | | 32.37 | | 8/01/2021 | | — | | — | | — | | — | | | | 3/01/2012 | | | 4,608 | | 1,536 | | 38.18 | | 3/01/2022 | | — | | — | | — | | — | | | | 3/01/2013 | | | 3,865 | | 3,866 | | 39.19 | | 3/01/2023 | | — | | — | | — | | — | | | | 3/01/2014 | | | — | | — | | — | | — | | — | | — | | 4,909 (3) | | 291,595 | | | | 3/01/2014 | | | — | | — | | — | | — | | 2,338 (2) | | 138,877 | | — | | — | | | | 3/01/2015 | | | — | | — | | — | | — | | 3,095 (2) | | 183,843 | | — | | — | Diane E. Ratekin | | | 3/11/2011 | | | 4,706 | | — | | 26.19 | | 3/11/2021 | | — | | — | | — | | — | | | | 3/01/2012 | | | 2,304 | | 768 | | 38.18 | | 3/01/2022 | | — | | — | | — | | — | | | | 3/01/2013 | | | 2,416 | | 2,416 | | 39.19 | | 3/01/2023 | | — | | — | | — | | — | | | | 3/01/2014 | | | — | | — | | — | | — | | — | | — | | 2,570 (3) | | 152,658 | | | | 3/01/2014 | | | — | | — | | — | | — | | 1,224 (2) | | 72,706 | | — | | — | | | | 3/01/2015 | | | — | | — | | — | | — | | 1,620 (2) | | 96,228 | | — | | — |
| | | | | | | | | | | | | | | | | | | | | | | | | | | | | | | | | | | | | Option Awards | | | | | | Stock Awards | | | Name | | Grant Date | | | Number of
Securities
Underlying
Unexercised
Options (#)
Exercisable | | | Number of
Securities
Underlying
Unexercised
Options (#)
Unexercisable | | Option Exercise Price ($) | | | Option
Expiration
Date | | | | | | Number of Shares or Units of
Stock that
Have Not
Vested (#) | | | Market Value of Shares or
Units of Stock that Have Not Vested as of 12/31/2017 ($) | | James H. Roth | | | 5/03/2010 | | | | 100,000 | | | — | | | 23.43 | | | | 5/03/2020 | | | | | | | | — | | | | — | | | | | 3/11/2011 | | | | 27,031 | | | — | | | 26.19 | | | | 3/11/2021 | | | | | | | | — | | | | — | | | | | 3/01/2012 | | | | 19,661 | | | — | | | 38.18 | | | | 3/01/2022 | | | | | | | | — | | | | — | | | | | 3/01/2013 | | | | 24,054 | | | — | | | 39.19 | | | | 3/01/2023 | | | | | | | | — | | | | — | | | | | 3/01/2014 | | | | — | | | — | | | — | | | | — | | | | | | | | 2,296 | (1) | | | 92,873 | | | | | 3/01/2015 | | | | — | | | — | | | — | | | | — | | | | | | | | 4,558 | (1) | | | 184,371 | | | | | 3/01/2016 | | | | — | | | — | | | — | | | | — | | | | | | | | 8,207 | (1) | | | 331,973 | | | | | | 3/15/2017 | | | | — | | | — | | | — | | | | — | | | | | | | | 19,804 | (2) | | | 801,072 | | C. Mark Hussey | | | 8/01/2011 | | | | 1,772 | | | — | | | 32.37 | | | | 8/01/2021 | | | | | | | | — | | | | — | | | | | 3/01/2012 | | | | 6,144 | | | — | | | 38.18 | | | | 3/01/2022 | | | | | | | | — | | | | — | | | | | 3/01/2013 | | | | 7,731 | | | — | | | 39.19 | | | | 3/01/2023 | | | | | | | | — | | | | — | | | | | 3/01/2014 | | | | — | | | — | | | — | | | | — | | | | | | | | 780 | (1) | | | 31,551 | | | | | 3/01/2015 | | | | — | | | — | | | — | | | | — | | | | | | | | 1,548 | (1) | | | 62,617 | | | | | 3/01/2016 | | | | — | | | — | | | — | | | | — | | | | | | | | 4,256 | (1) | | | 172,155 | | | | | 3/15/2017 | | | | — | | | — | | | — | | | | — | | | | | | | | 9,627 | (2) | | | 389,412 | | | | | | 8/21/2017 | | | | — | | | — | | | — | | | | — | | | | | | | | 32,051 | (1) | | | 1,296,463 | | John D. Kelly | | | 3/01/2014 | | | | — | | | — | | | — | | | | — | | | | | | | | 142 | (1) | | | 5,744 | | | | | 3/01/2015 | | | | — | | | — | | | — | | | | — | | | | | | | | 263 | (1) | | | 10,638 | | | | | 3/01/2016 | | | | — | | | — | | | — | | | | — | | | | | | | | 264 | (1) | | | 10,679 | | | | | 3/01/2017 | | | | — | | | — | | | — | | | | — | | | | | | | | 442 | (1) | | | 17,879 | | | | | | 3/15/2017 | | | | — | | | — | | | — | | | | — | | | | | | | | 2,384 | (2) | | | 96,433 | | Diane E. Ratekin | | | 3/01/2012 | | | | 3,072 | | | — | | | 38.18 | | | | 3/01/2022 | | | | | | | | — | | | | — | | | | | 3/01/2013 | | | | 4,832 | | | — | | | 39.19 | | | | 3/01/2023 | | | | | | | | — | | | | — | | | | | 3/01/2014 | | | | — | | | — | | | — | | | | — | | | | | | | | 408 | (1) | | | 16,504 | | | | | 3/01/2015 | | | | — | | | — | | | — | | | | — | | | | | | | | 810 | (1) | | | 32,765 | | | | | 3/01/2016 | | | | — | | | — | | | — | | | | — | | | | | | | | 1,621 | (1) | | | 65,569 | | | | | | 3/15/2017 | | | | — | | | — | | | — | | | | — | | | | | | | | 3,374 | (2) | | | 136,478 | |
| (1) | Option grants are subject to 25% vesting on each anniversary of the grant date provided the individual is still employed by Huron on the applicable vesting dates.
|
(2) | Consists of unvested restricted stock as of December 31, 20152017 that vests 25% annually over four years from the date of grant provided the individual is still employed by Huron on the applicable vesting dates. |
(3)(2) | Consists of 2014unvested restricted stock as of December 31, 2017 that vests 33% annually over three years from the date of grant of PSUs that are subject to further adjustment basedprovided the individual is still employed by Huron on performance for the 2014-2016 performance period. The amount of the further adjustment ranges from 75% to 200%. The amount reflected in the table equals the target amount of the three-year component of the original award that was adjusted after the end of the 2014 performance period to 125% of target based on 2014 annual performance, and further adjusted based on 2015 performance and estimated 2016 performance at target. The 2016 performance is an estimate and may increase or decrease based on actual performance during 2016. Once the 2014-2016 performance period is complete, 50% of the final award vests immediately and 50% of the final award is subject to a one-year service period through the end of 2017.applicable vesting date. |
2015 Option Exercises and Stock Vested2017 OPTION EXERCISESAND STOCK VESTED
The following table sets forth certain information concerning stock option exercises and restricted stock vesting during 20152017 for each named executive officer. No stock options held by the named executive officers were exercised during 2015. | | | | | | | | Stock Awards | Name | | Shares Acquired
On Vesting (#) (1) | | Value Realized
On Vesting ($) (2) | James H. Roth | | 23,134 | | 1,382,463 | C. Mark Hussey | | 9,978 | | 638,336 | Diane E. Ratekin | | 5,967 | | 365,045 |
| | | | | | | | | | | | | | | | | | | | Option Exercises | | | | | Stock Awards | | | Name | | Shares Acquired
on Exercise (#) | | Value Realized
on Exercise ($) | | | | | Shares Acquired
On Vesting (#) (1) | | | Value Realized
On Vesting ($)(2) | | James H. Roth | | 0 | | 0 | | | | | | | 18,330 | | | | 763,376 | | C. Mark Hussey | | 0 | | 0 | | | | | | | 7,392 | | | | 307,919 | | John D. Kelly | | 0 | | 0 | | | | | | | 731 | | | | 34,433 | | Diane E. Ratekin | | 0 | | 0 | | | | | | | 4,387 | | | | 184,513 | |
| (1) | Includes restricted stock that vested in 2015.2017. |
| (2) | The value realized on vesting equals the market value of Huron stock measured as the closing price of the stock on the most recent business day preceding the vesting date multiplied by the number of shares received on vesting. |
2015 Nonqualified Deferred Compensation2017 NONQUALIFIED DEFERRED COMPENSATION
The following table shows the deferred compensation activity for the named executive officers in 2015.2017. | | | | | | | | | | | Name | | Executive
Contributions
in 2015 ($)(1) | | Company
Contributions
in 2015 ($) | | Aggregate
Earnings in
2015 ($) | | Aggregate
Withdrawals/
Distributions
in 2015 ($) | | Aggregate
Balance as of
12/31/15($)(2) | James H. Roth | | 522,000 | | — | | (13,719) | | — | | 988,431 | C. Mark Hussey | | 148,500 | | — | | 7,620 | | — | | 696,266 | Diane E. Ratekin | | — | | — | | (632) | | — | | 107,700 |
| | | | | | | | | | | | | | | | | | | | | | Name | | Executive
Contributions
in 2017($)(1) | | | Company
Contributions
in 2017 ($) | | | Aggregate
Earnings in
2017($) | | | Aggregate
Withdrawals/
Distributions
in 2017 ($) | | | Aggregate
Balance as of
12/31/17($)(2) | | James H. Roth | | | 846,807 | | | | — | | | | 385,248 | | | | — | | | | 2,816,699 | | C. Mark Hussey | | | — | | | | — | | | | 177,842 | | | | — | | | | 1,020,498 | | John D. Kelly | | | — | | | | — | | | | — | | | | — | | | | — | | Diane E. Ratekin | | | — | | | | — | | | | 22,149 | | | | — | | | | 139,427 | |
| (1) | Executive contributions representinclude deferral of bonus for 2015,2017, which amounts are also included in theNon-Equity Incentive Plan Compensation column of the 20152017 Summary Compensation Table. These bonus amounts will be deposited into the accounts once 20152017 bonuses are paid in March 2016.2018. |
| (2) | The aggregate balance as of December 31, 20152017 includes amounts deferred with respect to 20152017 compensation that were funded after fiscalyear-end. |
The Company maintains the DCP, which became effective July 1, 2006. The DCP permits managing directors, corporate vice presidents and named executive officers to elect to defer up to 75% of their base salary and 100% of their annual cash incentive into a deferred compensation account and to choose from a number of generally available investment vehicles. Earnings are credited based on earnings of the investment options selected by the participant. Huron does not match any amounts deferred or otherwise contribute to the DCP except to make restoration payments to the accounts of participants who do not receive the maximum eligible 401(k) match as a result of participation in the DCP. Deferral elections for base salary and any guaranteed bonus must be made in the calendar year prior to earning such base salary or within 30 days of becoming eligible for the plan. The Company requires that deferral elections of the annual cash incentive must be made 12 months prior to the end of the applicable performance period. Independent directors may also defer up to 100% of their retainer and meeting fees into the DCP. Payments from the plan automatically begin upon termination of employment or separation from service as a director. Key employees, including executive officers, must wait six months after termination to receive payment from the plan. Participants may elect payment in a lump sum or annual installments for up to 15 years. Upon proof of financial hardship and approval from the Compensation Committee, a participant may be allowed an early distribution. Participants may also elect to receive payments prior to termination through a scheduled distribution. | POTENTIAL PAYMENTS UPON TERMINATION OR CHANGE OF CONTROL |
Background We have entered into agreements and maintain plans and arrangements that require us to pay or provide compensation and benefits to each of the named executive officers in the event of certain terminations of employment or a change of control. After a comprehensive review of the agreements in 2016, the Company entered into Amended and Restated Agreements with each of our NEOs, effective as of January 1, 2017. The provisions of these agreements, summarized below, are aligned with best practices. Senior Management Agreements The Company entered into an AmendedMr. Roth’s agreement covers a term beginning on January 1, 2017, and Restated Senior Management Agreement, effective ascontinues for three years from that date. Following the expiration of July 30, 2009, with James H. Roth, CEO and President of the Company (the “Roth Agreement”). Beginning on July 30, 2012 and on each anniversary thereafter, the Roth Agreement isthat initial three-year term, his agreement will be automatically renewed and extended for an additionalevery year, unless Mr. Roth or the Company provides 60 days’ notice to the other that such automatic renewal shall cease. The Roth Agreementagreement may be earlier terminated earlier by Mr. Roth or the Company pursuant to its terms.
The Company entered into a Senior Management Agreement, effective as of February 25, 2014, with C. MarkMr. Hussey, EVP, COOMr. Kelly and CFO ofMs. Ratekin’s agreements provide that employment will continue unless either the Company (the “Hussey Agreement”). Mr. Hussey’s employment by the Company is at will until such time as either Mr. Hussey or the Company terminates the agreement pursuant to its terms.
The Company entered into a Senior Management Agreement, effective as of February 22, 2011, with Diane E. Ratekin, EVP, General Counsel and Corporate Secretary of the Company (the “Ratekin Agreement”). Beginning on January 1, 2012 and on each anniversary thereafter, the Ratekin Agreement is automatically renewed and extended for an additional year unless Ms. Ratekin or the Company provides 60 days’ noticeexecutive delivers to the other that such automatic renewal shall cease. The Ratekin Agreement60 days’ advance written notice of the cessation of employment. These may be earlier terminated earlier by Ms. Ratekinthe executive or the Company pursuant to itstheir terms.
Annual Target Bonus
Each calendar year, each of Mr. Roth, Mr. Hussey and Ms. Ratekin will be eligible for an annual target bonus in an amount determined by the Compensation Committee based on each executive’s performance, Company performance and the Company’s compensation policies. Mr. Roth’s annual target bonus will not be less than 110% of his base salary.
Equity Awards
Mr. Roth, Mr. Hussey, and Ms. Ratekin will generally be eligible to participate in the Company’s equity plans, with the amount and terms of any equity awards being in the sole discretion of the Compensation Committee and based on performance and the Company’s compensation policies.
The following table summarizes how unvested equity awards will be addressed in the event of a termination.termination under the Senior Management Agreements that were in effect during 2017. | | | | | | Event | | Restricted Stock and Options | | Performance Shares | Normal Vesting | | 33% annual vesting over 3 years for awards granted on or after 3/15/2017; 25% annual vesting over 4 years for those awards granted prior to 3/15/2017 and for the award granted to C. Mark Hussey on 8/21/2017 | | 40%One-Year Performance Shares: 33% of earned sharesOne-Year Performance Shares vest in 1Q16; 60% subject to 2014-16 performance (50%each of Q1 2018, 2019 and 2020. Three-Year Performance Shares: 100% of the earned Three-Year Performance Shares vest in 1Q17, 50% in 1Q18).Q1 2020 provided that executive remains employed at Huron through the 2019 Performance Period. | Voluntary Termination | | Forfeit | | ForfeitOne-Year & Three-Year Performance Shares: Forfeit. | Termination for “Cause” | | Forfeit | | ForfeitOne-Year & Three-Year Performance Shares: Forfeit. | | Approved Retirement (comply withnon-compete provisions) | | Subject tonon-compete, vesting continues per normal course post-retirementpost- retirement | | One-Year & Three-Year Performance Shares: Earned pro rata based on actual performance. Subject tonon-compete, vesting continues per normal course post retirement.post-retirement. | Death or Disability | | Full acceleration | | One-Year Performance Shares: Immediately vest pro rata based on actual performance. Three-Year Performance Shares: Earned pro rata based on actual performance. Vesting accelerated at end of performance period.and will vest on March 15, 2020 on a pro rata basis. |
| | | | | Event | | Restricted Stock and Options | | Performance Shares | | Involuntary/Good Reason Termination | | Pro rata vesting | | EarnedOne-Year & Three-Year Performance Shares: Will receive a pro rata amount of earned shares based on actual performance.performance; vesting continues per normal course. | Change of Control (“COC”), No Termination | | No impact, assumed by acquirer | | One-Year & Three-Year Performance period ends upon COC. Shares earned equal average of (i) finished performance years: If assumed by acquirer and (ii) unfinished performance years assumed at 100% target. Vestingconverts shares into right to receive equivalent value shares in new entity then vesting continues per normal course. If not assumed by acquirer or acquirer does not convert shares into right to receive equivalent value in shares of new entity, then 100% of earned shares will vest and one share of Company common stock will be exchanged for each performance share and such common stock will receive the consideration paid by the acquirer in the COC. | Involuntary/Good Reason TerminationPost-COC | | Full acceleration | | Full accelerationOne-Year Performance Shares: Shares shall immediately fully vest. Three-Year Performance Shares: Earned shares shall immediately fully vest. |
Other Benefits Mr. Roth, Mr. Hussey, Mr. Kelly and Ms. Ratekin will be eligible to participate in the Company’s various health and welfare benefit plans for its similarly situated key management employees. Restrictive Covenants on Termination For the applicable restricted period set forth in each executive officer’s Senior Management Agreement, he or she may not directly or indirectly (i) hire any employees of the Company or solicit, induce or encourage any employee of the Company or any client of the Company to leave, alter or cease his or her relationship with it or (ii) provide services that are the same as or similar to those offered by the Company to any client of the Company that he or she obtained as a client for the Company, to whom he or she provided services within the 12 months preceding termination of employment, or to whom he or she submitted a proposal during the six months prior to termination of employment. The restricted period for Mr. Roth is 12 to 24 months (depending on the type of termination) following termination of employment for any reason.employment. The restricted period for Mr. Hussey, Mr. Kelly and Ms. Ratekin is 12 months following termination of employment for any reason. In addition, for a period of 12 to 24 months (depending on the type of termination) following the termination of his employment, for any reason, Mr. Roth may not, directly or indirectly, provide services that are competitive with those of the Company to any person, firm or other business entity. Executives are also subject to a confidentiality andnon-disclosure covenant. Key Definitions Definition of “Change of Control” A Change of Control is defined in all three agreements as: any person becomes a beneficial owner of 40% or more of the Company’s outstanding securities; there is a consummation of a merger or consolidation with any person unless (a) the voting securities of the Company outstanding immediately prior to the transaction continue to represent at least 50% of the combined voting power of the securities of the Company or such other surviving entity; (b) the merger is a recapitalization in which no person other than existing security holders becomes a beneficial owner representing 50% or more of the Company’s then outstanding securities; or (c) the merger does not represent a sale of all or substantially all of the Company’s assets; the stockholders approve a plan of complete liquidation or dissolution; or there is a disposition or sale of all or substantially all of the Company’s assets other than a sale or disposition in which at least 50% of the combined voting power of the voting securities which are owned by shareholders of Huron. Definition of “Good Reason” “Good Reason”In the new Senior Management Agreements that were entered into effective January 1, 2017, the definition of “Good Reason” was harmonized across all NEOs and is now defined in the Roth Agreementall four agreements to mean a resignation following: (i) a change in Mr. Roth’s primary location of employment to a location that is more than 75 miles from Chicago, Illinois; (ii) a material breach of the Roth Agreement by the Company; (iii) a material reduction in his base salary; (iv) a material diminishment of his position, title, duties or responsibilities; or (v) the execution of a binding agreement committing the Company to a Change of Control (as defined in the Roth Agreement) without also committing legally and announcing publicly that Mr. Roth shall become the Chief Executive Officer of the surviving Company. The Roth Agreement provides the Company the right to cure prior to a resignation for Good Reason.
“Good Reason” is defined in the Hussey Agreement to mean a resignation following: (i) a change in Mr. Hussey’s primary location of employment to a location that is more than 50 miles from Chicago, Illinois; (ii) a failure to comply with any material term of the Hussey Agreementagreement by the Company;Company or (iii) a material reduction in his base salary or benefits coverage, provided that such reduction is without his or her consent, is not warranted by the Company’s financial condition, and is not a change that applies uniformly to similarly situated Company executives. The Hussey Agreement providesagreements provide the Company the right to cure prior to a senior executive’s resignation for Good Reason.
“Good Reason” is defined in the Ratekin Agreement to mean a resignation following a change in Ms. Ratekin’s primary location of employment to a location that is more than 75 miles from Chicago, Illinois. The Ratekin Agreement provides the Company the right to cure prior to a resignation for Good Reason.
Definition of “Good Reason” in Relation to a Change of Control Under all threefour agreements, a Change of Control Good Reason occurs if certain adverse changes occur in anticipation of, or within two years following, a Change of Control including: | | (a) | any material breach of the Senior Management Agreement by the Company, |
| | (b) | any material adverse change in the executive’s status, responsibilities or position with the Company, |
| | (c) | any material reduction in his or her base salary or target bonus, other than in connection with anacross-the-board reduction in base salaries applicable in like proportions to all similarly situated executives of the Company and any direct or indirect parent of the Company, |
| | (d) | assignment of duties to the executive that are materially inconsistent with his or her position and responsibilities described in the Senior Management Agreement, including, specifically, assignment of a position other than as Chief Executive Officer of the surviving Company in the case of Mr. Roth, or |
| | (e) | requiring the executive to be principally based at any office or location that is greater than 75 miles from Chicago, Illinois with respect to Mr. Roth and Ms. Ratekin and greater than 50 miles from Chicago, Illinois with respect to Mr. Hussey.Illinois. |
Termination without Cause or Resignation for Good Reason If any of our executives with a Senior Management Agreement is terminated without Cause or resigns for Good Reason, as defined in his or her Senior Management Agreement, upon executing a general release and waiver, the Company is obligated to pay severance and continuation of benefits in varying amounts. In addition, unvested equity will accelerate on a pro rata basis upon termination without Cause or resignation for Good Reason. The following severance benefits are payable to each of our named executive officers upon termination without Cause or resignation for Good Reason, except in the case of a Change of Control, as of December 31, 2015:2017: | | | | Executive | | Severance Benefits | James H. Roth | | An amount in cash equal to two times the sum of his then current annual base salary and his then current target bonus,bonus; pro rata bonus in the year of termination based on actual results, 12results; 24 months’ continuation of medical, dental and vision insurance coverage,coverage; pro rata vesting of all unvested restricted shares and service-based option awards, and pro rata vesting of performance shares that would otherwise have been earned in the year of termination. Severance amounts are payable in a lump sum. | C. Mark Hussey | | An amount in cash equal to six monthsone andone-half times the sum of his then current annual base salary sixand his then current target bonus, and a pro rata bonus in the year of termination based on actual results, 18 months’ continuation of medical insurance, pro rata vesting of all unvested restricted shares, and pro rata vesting of performance shares that would otherwise have been earned in the year of termination. Severance amounts are payable in a lump sum. | John D. Kelly & Diane E. Ratekin | | An amount in cash equal to six monthsthe sum of his or her then current annual base salary sixand his or her then current target bonus, and pro rata bonus in the year of termination based on actual results, 12 months’ continuation of medical insurance, pro rata vesting of all unvested restricted shares, and pro rata vesting of performance shares that would otherwise have been earned in the year of termination. Severance amounts are payable in a lump sum. |
In the event an executive qualifies for an approved retirement and signs anon-compete agreement, he or she would receive continued vesting of his or her stock options and restricted stock. There would be no acceleration, but the equity would continue to vest per the schedule as outlined in the grant agreements. Termination of Employment Due to Death or Disability If any of our executives dies or becomes disabled, his or her estate will receive payment of base salary and a pro rata bonus at target through the date of termination. The executive and/or his or her eligible dependents shall receive in the case of Mr. Roth, continuation of medical, dental and vision benefits for six months and for all other executives, continuation of medical benefits for three months. In addition, all unvested time-based equity outstanding will vest if any of our executives dies or becomes disabled.and unvested performance-based awards will vest in accordance with the applicable performance share equity agreement. Termination of Employment Due to Termination other than for Resignation for Good Reason or Due to Cause No severance or benefits are paid if an executive officer is terminated for Cause or resigns other than for Good Reason as defined in the executive’s Senior Management Agreement. Termination without Cause or Resignation for Good Reason Related to a Change of Control If any of our executives with a Senior Management Agreement is terminated without Cause or resigns for Good Reason in conjunction with a Change of Control, as defined in his or her Senior Management Agreement, upon executing a general release and waiver, the Company is obligated to pay severance and continuation of benefits in varying amounts. The following severance benefits are payable to each of our named executive officers upon termination without Cause or resignation for Good Reason, in the case of a Change of Control, as of December 31, 2015:2017: | | | | Executive | | Severance Benefits | James H. Roth | | An amount in cash equal to two andone-halftimes the sum of his then current annual base salary and his then current target bonus, pro rata target bonus in the year of termination, 2430 months’ continuation of medical, dental and vision insurance coverage, and accelerated vesting of all outstanding equity grants that were awarded at or prior to the time of the Change of Control. Severance amounts are payable in a lump sum. | C. Mark Hussey | | An amount in cash equal to two times the sum of his then current annual base salary and his then current target bonus, pro rata target bonus in the year of termination, twelve24 months’ continuation of medical insurance, and accelerated vesting of all outstanding equity grants that were awarded at or prior to the time of the Change of Control. Severance amounts are payable in a lump sum. | John D. Kelly & Diane E. Ratekin | | An amount in cash equal to one andone-half times the sum of his or her then current annual base salary and his or her then current target bonus, pro rata target bonus in the year of termination, twelve18 months’ continuation of medical insurance and accelerated vesting of all outstanding equity grants that were awarded at or prior to the time of the Change of Control. Severance amounts are payable in a lump sum. |
Golden Parachute Cutback All threefour Senior Management Agreements provide that, if any amount, right or benefit paid or payable to the executive under his or her Senior Management Agreement or any other plan, program or arrangement would constitute an “excess parachute payment” under Section 280G of the Code, subject to the excise tax imposed by Section 4999 of the Code, then the amount of payments payable to the executive under his or her Senior Management Agreement will be reduced to the extent necessary so that no portion of such payments is subject to such excise tax. Potential Payments upon Termination or Change of ControlPOTENTIAL PAYMENTSUPON TERMINATIONOR CHANGEOF CONTROL
The estimated amount payable or provided to each named executive officer in each situation is summarized below. These estimates are based on the assumption that the various triggering events occurred on the last day of 2015,2017, along with other material assumptions noted below. The actual amounts that would be paid to a named executive officer upon termination or a change of control can only be determined at the time the actual triggering event occurs. The estimated amount of compensation and benefits described below does not take into account compensation and benefits that a named executive officer has earned prior to the applicable triggering event, such as equity awards that have previously vested in accordance with their terms or vested benefits otherwise payable under our compensation programs. The following table and summary set forth potential payments we would be required to make to our named executive officers upon termination of employment or change of control. The table assumes termination of employment on December 31, 20152017 and uses a share price of $59.40,$40.45, the closing price of our stock on December 31, 2015.29, 2017, the last trading day before our fiscal year end. | | | | | | | | | | | | | | | Name | | Benefit | | Termination
without Cause or
Resignation for
Good Reason ($) | | | Permanent Disability or
Death ($) | | | Involuntary
Termination Following
Change of Control ($) | | James H. Roth | | Salary | | | 900,000 | | | | — | | | | 1,800,000 | | | | Bonus | | | 990,000 | | | | — | | | | 1,980,000 | | | | Pro rata bonus (1) | | | 594,000 | | | | — | | | | 990,000 | | | | Equity acceleration (2) | | | 1,303,940 | | | | 1,698,659 | | | | 3,423,797 | | | | Benefits continuation | | | 13,577 | | | | 6,789 | | | | 28,580 | | | | Cutback | | | — | | | | — | | | | — | | | | Total Value | | | 3,801,517 | | | | 1,705,447 | | | | 8,222,377 | | C. Mark Hussey | | Salary | | | 275,000 | | | | — | | | | 550,000 | | | | Bonus | | | — | | | | — | | | | 495,000 | | | | Pro rata bonus | | | — | | | | — | | | | 495,000 | | | | Equity acceleration (2) | | | 547,510 | | | | 569,537 | | | | 1,155,191 | | | | Benefits continuation | | | 6,345 | | | | 3,172 | | | | 13,030 | | | | Cutback | | | — | | | | — | | | | -185,754 | | | | Total Value | | | 828,855 | | | | 572,710 | | | | 2,522,467 | | Diane E. Ratekin | | Salary | | | 200,000 | | | | — | | | | 400,000 | | | | Bonus | | | — | | | | — | | | | 200,000 | | | | Pro rata bonus | | | — | | | | — | | | | 200,000 | | | | Equity acceleration (2) | | | 233,997 | | | | 305,311 | | | | 611,961 | | | | Benefits continuation | | | 6,267 | | | | 3,134 | | | | 12,871 | | | | Cutback | | | — | | | | — | | | | — | | | | Total Value | | | 440,264 | | | | 308,445 | | | | 1,424,832 | |
| | | | | | | | | | | | | | | | Name | | Benefit | | Termination without
cause or Resignation
for Good Reason ($) | | | Permanent Disability
or Death ($) | | | Involuntary
Termination Following
Change of Control ($) | | James H. Roth | | Salary | | | 1,800,000 | | | | 0 | | | | 2,250,000 | | | | Bonus | | | 1,980,000 | | | | 0 | | | | 2,475,000 | | | | Pro rata bonus (1) | | | 595,980 | | | | 990,000 | | | | 990,000 | | | | Equity acceleration (2) | | | 584,730 | | | | 2,157,967 | | | | 2,157,967 | | | | Benefits continuation | | | 27,966 | | | | 6,992 | | | | 34,958 | | | | | Cutback (3) | | | 0 | | | | 0 | | | | 0 | | | | | Total Value | | | 4,988,676 | | | | 3,154,959 | | | | 7,907,925 | | C. Mark Hussey | | Salary | | | 1,125,000 | | | | 0 | | | | 1,500,000 | | | | Bonus | | | 1,125,000 | | | | 0 | | | | 1,500,000 | | | | Pro rata bonus (1) | | | 451,500 | | | | 750,000 | | | | 750,000 | | | | Equity acceleration (2) | | | 374,133 | | | | 2,315,649 | | | | 2,315,649 | | | | Benefits continuation | | | 20,975 | | | | 6,992 | | | | 27,966 | | | | | Cutback (3) | | | 0 | | | | 0 | | | | -1,118,728 | | | | | Total Value | | | 3,096,608 | | | | 3,072,641 | | | | 4,974,887 | | John D. Kelly | | Salary | | | 325,000 | | | | 0 | | | | 487,500 | | | | Bonus | | | 227,500 | | | | 0 | | | | 341,250 | | | | Pro rata bonus (1) | | | 136,955 | | | | 227,500 | | | | 227,500 | | | | Equity acceleration (2) | | | 47,285 | | | | 231,366 | | | | 231,366 | | | | Benefits continuation | | | 13,490 | | | | 6,745 | | | | 20,235 | | | | | Cutback (3) | | | 0 | | | | 0 | | | | -126,140 | | | | | Total Value | | | 750,230 | | | | 465,611 | | | | 1,181,711 | | Diane E. Ratekin | | Salary | | | 400,000 | | | | 0 | | | | 600,000 | | | | Bonus | | | 200,000 | | | | 0 | | | | 300,000 | | | | Pro rata bonus (1) | | | 120,400 | | | | 200,000 | | | | 200,000 | | | | Equity acceleration (2) | | | 105,365 | | | | 378,701 | | | | 378,701 | | | | Benefits continuation | | | 13,490 | | | | 6,745 | | | | 20,235 | | | | | Cutback (3) | | | 0 | | | | 0 | | | | 0 | | | | | Total Value | | | 839,255 | | | | 585,446 | | | | 1,498,936 | |
| (1) | Mr. Roth’s proPro rata bonus for termination without Cause or resignation for Good Reason is based on actual performance from 2015.2017. See “Compensation Discussion and Analysis”CD&A for disclosure regarding amount earned.
|
| (2) | The acceleration of equity varies by grant and type of termination as outlined in the preceding sections. The value of all whole value sharesshown is equal to the number of accelerated shares times the closing price on December 31, 2015. The valuethe last day of all accelerated options equals the number of accelerated options, multiplied by the closing price on December 31, 2015 minus the exercise price.fiscal year. These amounts do not reflectinclude the value of stock that continues to vest per the original schedule post termination. Intermination, including: |
| (a) | A portion of the performance shares would continue to vest for each of the named executive officers with the number of shares determined based on an actual performance and prorated for the number of days that the executive was employed during the performance period. |
| (b) | Additionally, in the event an executive qualifies for an approved retirement, they would receive continued vesting of their stock. There would be no acceleration; the equity would continue to veststock per the schedule as outlined in the grant agreements.agreements (currently, none of the named executive officers satisfy the retirement criteria for these programs). |
The 2015 performance share unit value included above represents treatment for termination during the annual performance period. For all termination scenarios above, the awards are assumed earned using the actual performance from the annual performance period which was 0% for 2015.
| (3) | In the event the total CIC severance exceeds the IRC 280G safe harbor amount, then the executive’s cash severance is reduced to the maximum safe harbor threshold amount as to not trigger any excise tax. |
The 2014 performance share unit value included above represents treatment for termination after the annual performance period and during the three-year performance period. For both termination without Cause and Death or Disability, the awards are assumed earned using the actual performance from the annual performance period which was 125% for 2014 and the actual performance for 2015 which was 0%. Using the three-year multiplier table, this level of performance would result in a multiplier of 90%. As a result, the 2014 shares assumed to be earned are 125% of the original target award multiplied by 90%. For both Termination without Cause and Death or Disability, the awards are then prorated for the time employed versus the time between the grant date and the various vesting dates. For Change of Control, the amount earned is based on actual performance of 125% for 2014, 0% for 2015, and 100% assumed to be earned for 2016. This level of performance would result in a multiplier of 90%. As a result, the 2014 shares assumed to be earned are 125% of the original target award multiplied by 90% which become fully vested should a qualifying termination occur as a result of the change of control.
Compensation Committee Interlocks and Insider ParticipationCOMPENSATION COMMITTEE INTERLOCKSAND INSIDER PARTICIPATION
During 2015,2017, there were no Compensation Committee interlocks and no insider participation in Compensation Committee decisions that were required to be reported under the rules and regulations of the 1934 Act. Certain Relationships and Related TransactionsCERTAIN RELATIONSHIPSAND RELATED TRANSACTIONS
It is the responsibility of the Audit Committee to review and approve, ratify or disapprove of proposed transactions or courses of dealings with respect to which executive officers or directors or members of their immediate families have an interest (including all transactions required to be disclosed pursuant to the SEC’s related person disclosure requirements). In addition, it is the policy of management and board members to discuss at a meeting of the board of directors, or the appropriate board committee, those transactions requiring disclosure pursuant to the SEC’s related person disclosure requirements between Huron and a board member or a principal stockholder and members of their immediate families. On and effective February 8, 2018, the board of directors of Huron elected Hugh E. Sawyer as a Class II director of Huron, to serve until the May 2018 Annual Meeting. Mr. Sawyer will stand forre-election at the 2018 Annual Meeting. Since April 2017, Mr. Sawyer has served as the President and Chief Executive Officer, as well as a director, of Regis Corporation (“Regis”), a company that owns, franchises and operates beauty salons worldwide. Prior to that, Mr. Sawyer served as a managing director at Huron. Mr. Sawyer also serves as a member of the board of directors of JHT Holdings, Inc. The Company has provided general business advisory and transaction advisory services to Regis beginning in 2016. The aggregate fees received by the Company from Regis were $5.6 million in 2017, and $11,000 in 2018 (through January 31, 2018). As a director of the Company, Mr. Sawyer will receive compensation as anon-employee director in accordance with the Company’snon-employee director compensation practices described in the Company’s 2017 Annual Proxy Statement filed with the SEC on March 27, 2017. This compensation generally consists of an annual cash retainer in the amount of $60,000, $1,000 for each meeting of the board or any committee of the board that he attends, and an annual grant of restricted stock on the date of the Company’s annual meeting with a value of $170,000. Mr. Sawyer’s initial cash retainer will be prorated to reflect his appointment date. On March 1, 2018, Mr. Sawyer received a new director restricted stock award having a value equal to $200,000, vesting ratably over the following 12 calendar quarters beginning April 1, 2018. Mr. Sawyer will not receive an annual grant of restricted stock until the 2018 Annual Meeting provided he isre-elected to the board at that time. There are no arrangements or understandings between Mr. Sawyer and any other persons pursuant to which he was elected as a director. In addition, Huron has a Code of Business Conduct and Ethics (the “Code of Conduct”), a copy of which is posted on our web site at www.huronconsultinggroup.com,, that applies to directors and employees and their family members. The Code of Conduct, among other things, has a policy governing conflicts of interest generally and, in particular, prohibiting certain business arrangements with the Company and clients of the Company, entering into relationships that may be perceived as impairing the ability of the individual or Huron from performing his or its duties, as the case may be, in an impartial manner, and use of corporate property for improper personal gain. Any exceptions require disclosure and approval by the Chief Compliance Officer and, in the case of officers and directors, by the Audit Committee of the board of directors. The Code of Conduct also prohibits Huron from making any personal loans or guaranteeing any personal obligations of board members and executive officers. PROPOSAL 2 ADVISORY VOTE ONTO APPROVE THE COMPANY’S EXECUTIVE COMPENSATION As required by the Dodd-Frank Wall Street Reform and Consumer Protection Act of 2010 (the “Dodd-Frank Act”) and the SEC, Huron annually is asking its stockholders to indicate their support for our named executive officer compensation, which includes the compensation discussion and analysis, the compensation tables and the related narrative disclosures, all as described in the section entitled “EXECUTIVE COMPENSATION—Compensation Discussion and Analysis.” The vote solicited by this proposal, commonly known as “Say on Pay,” is advisory in nature and will not be binding on the board of directors, the Compensation Committee or Huron. However, the board of directors and the Compensation Committee value the opinions of our stockholders, will review the voting results and, to the extent determined appropriate, take into account the outcome of the vote during future deliberations on executive compensation arrangements. At the 20152017 Annual Meeting of Stockholders, in excess of 99% of the votes cast on this proposal voted to support Huron’s named executive officer compensation. Huron believes that its executive compensation program is structured to support Huron and its business objectives. This vote is not intended to address any one specific item of compensation, but rather the overall compensation of our named executive officers and the philosophy, policies and practices described in this Proxy Statement. The affirmative vote of the holders of a majority of the total shares of common stock, present in person or represented by proxy and entitled to vote on the proposal, is required to approve the advisory vote on the compensation arrangements of our named executive officers. Abstentions will have the same effect as a vote against the proposal. Brokernon-votes will not be considered shares entitled to vote with respect to the proposal and will not be counted as votes for or against the proposal and will therefore have no effect on the outcome of the proposal. Proxies submitted pursuant to this solicitation will be voted “FOR” the approval of the advisory vote on the compensation arrangements of our named executive officers, unless specified otherwise. THE BOARD OF DIRECTORS RECOMMENDS THAT STOCKHOLDERS VOTE “FOR” THE COMPENSATION OF OUR NAMED EXECUTIVE OFFICERS AS DISCLOSED IN THE COMPENSATION DISCUSSION AND ANALYSIS SECTION AND THE ACCOMPANYING COMPENSATION TABLES AND NARRATIVE DISCUSSION IN THIS PROXY STATEMENT. PROPOSAL 3 RATIFICATION OF APPOINTMENT OF INDEPENDENT REGISTERED PUBLIC ACCOUNTING FIRM PricewaterhouseCoopers LLP (“PwC”), which has been the independent registered public accounting firm for the Company since its inception, has been appointed by the Audit Committee as the independent registered public accounting firm for the Company and its subsidiaries for the fiscal year ending December 31, 2016.2018. This appointment is being presented to the stockholders for ratification. The ratification of the appointment of PwC as the independent registered public accounting firm requires the affirmative vote of the holders of a majority of the total shares of common stock present in person or represented by proxy and entitled to vote on the proposal, provided that a quorum is represented at the meeting. Abstentions will have the same effect as a vote against ratification. Brokernon-votes will not be considered shares entitled to vote with respect to ratification of the appointment and will not be counted as votes for or against the ratification and will therefore have no effect on the outcome of this proposal. Proxies submitted pursuant to this solicitation will be voted “FOR” the ratification of PwC as the Company’s independent registered public accounting firm for the fiscal year ending December 31, 2016,2018, unless specified otherwise. THE BOARD OF DIRECTORS RECOMMENDS THAT STOCKHOLDERS VOTE “FOR” THE RATIFICATION OF THE APPOINTMENT OF PRICEWATERHOUSECOOPERS LLP AS THE COMPANY’S INDEPENDENT REGISTERED PUBLIC ACCOUNTING FIRM FOR THE FISCAL YEAR ENDING DECEMBER 31, 2016.2018. Representatives of PwC are expected to be present at the Annual Meeting and will be provided an opportunity to make a statement and to respond to appropriate inquiries from stockholders. Audit and Non-Audit FeesAUDITAND NON-AUDIT FEES
The following table presents fees for professional audit services rendered by PwC for the audit of the Company’s annual financial statements for the years ended December 31, 20152017 and December 31, 2014,2016, and fees for other services rendered by PwC during those periods: | | | | 2015 | | | 2014 | | | 2017 | | | | | | 2016 | | | | | (in thousands) | | | (in thousands) | | Audit Fees | | $ | 1,680 | | | $ | 1,248 | | | $ | 1,686 | | | | | $ | 1,393 | | Audit-Related Fees | | | 10 | | | | 10 | | | $ | 53 | | | | | $ | 419 | | Tax Fees | | | 31 | | | | 32 | | | $ | 35 | | | | | $ | 33 | | All Other Fees | | | 4 | | | | 4 | | | $ | 3 | | | | | $ | 2 | | | | | | | | | | | | | | | | Total | | $ | 1,725 | | | $ | 1,294 | | | $ | 1,777 | | | | | $ | 1,847 | |
Audit Fees—all services, including tax services and accounting consultation, necessary to perform an audit of the consolidated financial statements of Huron; services in connection with statutory and regulatory filings or engagements, comfort letters, statutory audits, attest services and consents; and assistance with and review of documents filed with the SEC. Audit-Related Fees—due diligence related to mergers and acquisitions; internal control reviews; attest services that are not required by statute or regulations; and consultation concerning financial accounting and reporting standards. Tax Fees—tax compliance (review of original and amended tax returns, claims for refund and tax payment-planning services); tax planning; and other tax advice (assistance with tax audits and appeals, tax advice related to structural matters, and requests for rulings or technical advice from taxing authorities). All Other Fees—any other work that is not audit, audit-related or a tax service. The Audit Committee considers whether the provision of these services is compatible with maintaining the independence of the independent registered public accounting firm and has determined such services for fiscal 20152017 and 20142016 were compatible. Policy on Audit Committee Preapproval of Audit and Non-Audit Services of Independent Registered Public Accounting FirmPOLICYON AUDIT COMMITTEE PREAPPROVALOF AUDITAND NON-AUDIT SERVICESOF INDEPENDENT REGISTERED PUBLIC ACCOUNTING FIRM
The Audit Committee is responsible for appointing, setting compensation and overseeing the work of the independent registered public accounting firm. The Audit Committee has established a policy regarding preapproval of all audit andnon-audit services provided by the independent registered public accounting firm. The Audit Committee, on a periodic basis, determines certain services that have the general preapproval of the Committee. The Audit Committee must separately preapprove any services not receiving such general preapproval. Requests for such approval must be submitted by both the independent registered public accounting firm and the CFO and must include a joint statement as to whether, in their view, the request is consistent with the SEC’s rules on auditor independence. No services are undertaken that are not preapproved. The Audit Committee will establish preapproved fee levels for all services to be provided by the independent registered public accounting firm. On a periodic basis, the CFO and the independent registered public accounting firm report to the Audit Committee regarding the actual spending for such projects and services compared to the approved amounts. Report of the Audit CommitteeREPORTOFTHE AUDIT COMMITTEE
The primary purpose of the Audit Committee is to assist the board of directors in its general oversight of the Company’s financial reporting process. The Audit Committee conducted its oversight activities for Huron Consulting Group Inc. and subsidiaries (“Huron”) in accordance with the duties and responsibilities outlined in the Audit Committee charter. Huron’s management is responsible for the preparation, consistency, integrity and fair presentation of the financial statements, accounting and financial reporting principles, systems of internal control and procedures designed to ensure compliance with accounting standards, applicable laws and regulations. Huron’s independent registered public accounting firm, PwC, is responsible for performing an independent audit of Huron’s financial statements and the effectiveness of internal control over financial reporting. The Audit Committee, with the assistance and support of the Huron finance department and management of Huron, has fulfilled its objectives, duties and responsibilities as stipulated in the Audit Committee charter and has provided adequate and appropriate independent oversight and monitoring of Huron’s systems of internal control for the fiscal year ended December 31, 2015.2017. These activities included, but were not limited to, the following during the fiscal year ended December 31, 2015:2017: Discussed with Huron’s internal auditors their continuing work in support of examination of internal controls and financial compliance controls. Reviewed and discussed with management and PwC the audited financial statements and the quarterly financial statements for the year ended December 31, 2015.2017. Management has the primary responsibility for such financial statements. Discussed with PwC the matters requiring discussion under current auditing standards. Received the written disclosures and the letter from PwC in accordance with the applicable requirements of the Public Company Accounting Oversight Board regarding PwC’s communications with the Audit Committee concerning independence. In reliance on the Committee’s review and discussions of the matters referred to above, the Audit Committee recommended to the board of directors that the audited financial statements be included in Huron’s Annual Report on Form10-K for the fiscal year ended December 31, 20152017 for filing with the Securities and Exchange Commission. H. Eugene Lockhart, Chairman John McCartney John S. Moody SUBMISSION OF STOCKHOLDER PROPOSALS In order to be included in the Company’s proxy statement relating to its next annual meeting, stockholder proposals must be received no later than November 18, 201626, 2018 by the Corporate Secretary at the Company’s principal executive offices. Pursuant to the Company’s bylaws, stockholders who intend to present an item for business at the next annual meeting (other than a proposal submitted for inclusion in the Company’s proxy materials) must provide notice to the Corporate Secretary no earlier than January 6, 20174, 2019 and no later than February 5, 2017.3, 2019. Notice of stockholder proposals must contain the information required by the Company’s bylaws. The inclusion of any such proposal in such proxy material shall be subject to the requirements of the proxy rules adopted under the 1934 Act. OTHER MATTERS Management does not now intend to bring before the Annual Meeting any matters other than those disclosed in the Notice of Annual Meeting of Stockholders, and it does not know of any business that persons, other than management, intend to present at the meeting. Should any other matters requiring a vote of the stockholders arise, the proxies in the enclosed form confer discretionary authority on the board of directors to vote on any other matter proposed by stockholders in accordance with their best judgment. Votes against proposals or abstentions from voting on proposals will not be used to adjourn or postpone the Annual Meeting of Stockholders. The Company will bear the cost of soliciting proxies. To the extent necessary, proxies may be solicited by directors, officers and employees of the Company in person, by telephone or through other forms of communication, but such persons will not receive any additional compensation for such solicitation. The Company will reimburse brokerage firms, banks and other custodians, nominees and fiduciaries for reasonable expenses incurred by them in sending proxy materials to the beneficial owners of the Company’s shares. The Company will supply banks, brokers, dealers and other custodian nominees and fiduciaries with proxy materials to enable them to send a copy of such materials by mail to each beneficial owner of shares of the common stock that they hold of record and will, upon request, reimburse them for their reasonable expenses in so doing. | By Order of the Board of Directors |  
| Diane E. Ratekin Executive Vice President, General Counsel
and Corporate Secretary
|
Chicago, Illinois March 24, 201626, 2018 
| | | | | 
| | | | Admission Ticket | | | | | Electronic Voting Instructions | | | You can vote by Internet! | | Available 24 hours a day, 7 days a week! | | | Instead of mailing your proxy, you may choose one of the voting methods outlined below to vote your proxy. | | | VALIDATION DETAILS ARE LOCATED BELOW IN THE TITLE BAR. | | | Proxies submitted by the Internet must be received by | 1:00 a.m., Central Time, on May 6, 2016.4, 2018. | | Vote by Internet | | • Go towww.envisionreports.com/HURN | | • Or scan the QR code with your smartphone | | • Follow the steps outlined on the secure website |
| | | | | | Using ablack inkpen, mark your votes with anXas shown in this example. Please do not write outside the designated areas. | | x☒
| | |

q IF YOU HAVE NOT VOTED VIA THE INTERNET, FOLD ALONG THE PERFORATION, DETACH AND RETURN THE BOTTOM PORTION IN THE ENCLOSED ENVELOPE. q | | A | | Proposals — The Board recommends a voteFOR all nominees,FOR Proposals 2 and 3. | | Proposals — The Board recommends a voteFOR all nominees,FOR Proposals 2 and 3. | 1. | | Election of Directors: | | For | | Withhold | | | | | | | | For | | Withhold | | | | For | | Withhold | | | | + | | Election of Directors: | | For | | Withhold | | | | | | | | | | For | | Withhold | | | | For | | Withhold | | | | + | | | 01 - James D. Edwards | | ¨ | | ¨ | | 02 - John McCartney | | ¨ | | ¨ | | 03 - James H. Roth | | ¨ | | ¨ | | | | | 01 - John S. Moody | | ☐ | | ☐ | | 02 - Hugh E. Sawyer | | ☐ | | ☐ | | 03 - Debra Zumwalt | | ☐ | | ☐ | | | | | | | | | | | | For | | Against | | Abstain | | | | | | For | | Against | | Abstain | | | | | | | | | | | For | | Against | | Abstain | | | | | | | | For | | Against | | Abstain | | 2. | | Say on Pay - An advisory vote on the approval of executive compensation. | | ¨ | | ¨ | | ¨ | | 3. | | To ratify the appointment of PricewaterhouseCoopers LLP as the Company’s independent registered public accounting firm for the fiscal year ending December 31, 2016. | | ¨ | | ¨ | | ¨ | | | An advisory vote to approve the Company’s executive compensation. | | | | ☐ | | ☐ | | ☐ | | 3. | | To ratify the appointment of PricewaterhouseCoopers LLP as the Company’s independent registered public accounting firm for the fiscal year ending December 31, 2018. | | ☐ | | ☐ | | ☐ |
| | | | | | | | | | | | | | B | | Non-Voting Items | | | | | | | | | | | | | | | | | | Change of Address — Please print your new address below. | | | | Comments — Please print your comments below. | | | | Meeting Attendance | | | | | | | | | | | | Mark the box to the right if you plan to attend the Annual Meeting. | | ¨☐ | | | | | | | | | |
| | | | | | | | | | | | | | C | | Authorized Signatures — This section must be completed for your vote to be counted. — Date and Sign Below | | Please sign exactly as name(s) appears hereon. Joint owners should each sign. When signing as attorney, executor, administrator, corporate officer, trustee, guardian, or custodian, please give full title. |
| | | | | | | | | | | Date (mm/dd/yyyy) — Please print date below. | | | | Signature 1 — Please keep signature within the box. | | | | Signature 2 — Please keep signature within the box. | | | | / / | | | | | | | | | | |
02B1ZA
20162018 Annual Meeting Admission Ticket
20162018 Annual Meeting of
Huron Consulting Group Inc. Stockholders Friday, May 6, 2016,4, 2018, 11:00 a.m. Central Time 550 West Van Buren Street, 17th Floor Chicago, Illinois 60607 Upon arrival, please present this admission ticket and photo identification at the registration desk. q IF YOU HAVE NOT VOTED VIA THE INTERNET, FOLD ALONG THE PERFORATION, DETACH AND RETURN THE BOTTOM PORTION IN THE ENCLOSED ENVELOPE. q  
Proxy — Huron Consulting Group Inc. Notice of 20162018 Annual Meeting of Stockholders 550 West Van Buren Street, 17th Floor, Chicago, Illinois 60607 Proxy Solicited by Board of Directors for Annual Meeting — Friday, May 6, 20164, 2018 James H. Roth and Diane E. Ratekin, or any of them, each with the power of substitution, are hereby authorized to represent and vote the shares of the undersigned, with all the powers which the undersigned would possess if personally present, at the Annual Meeting of Stockholders of Huron Consulting Group Inc. to be held on May 6, 20164, 2018 or at any postponement or adjournment thereof. Shares represented by this proxy will be voted by the stockholder. If no such directions are indicated, the Proxies will have authority to vote FOR all nominees, FOR Proposals 2 and 3. In their discretion, the Proxies are authorized to vote upon such other business as may properly come before the meeting. (Items to be voted appear on reverse side.) |